

Analytic tools are critical to prove your performance to clients. They let you generate reports with key metrics regarding user engagement.
While some tools are specialized for website performance, others are more focused on SEO or marketing efforts. By combining these tools you can get a better understanding of what’s working and what’s not working for your business.
We’ll take a look at 8 amazing analytics tools for agencies, their strengths, and drawbacks.
Quick List of The 8 Best Analytics Tools for Agencies
- AgencyAnalytics: Offers customizable dashboards for comprehensive client reporting.
- Google Analytics: Provides in-depth website traffic analysis and user behavior insights.
- Hotjar: Combines heatmaps and session recordings to visualize user interactions.
- Microsoft Clarity: Delivers free heatmaps and session recordings for user behavior analysis.
- Tableau: Transforms data into interactive, shareable visualizations for insightful analysis.
- Mixpanel: Focuses on product analytics to track user engagement and retention.
- Heap.io: Automatically captures all user interactions for comprehensive behavioral data.
- Voluum: Specializes in tracking and optimizing advertising campaigns across multiple platforms.
Comparison Table: Top 8 Analytics Tools for Agencies
To simplify your decision, we’ve created a comparison table of the 8 best analytics tools for agencies.
| Software | Top 2 Features | Integrations | Starting Price | Best Use Case |
| AgencyAnalytics | – Custom dashboards- Automated reporting | Google Analytics, SEO tools, social media | $49/month | Agencies needing in-depth client reporting |
| Google Analytics | – Real-time tracking- Audience segmentation | Google Ads, Search Console, Data Studio | Free | Website traffic and user behavior analysis |
| Hotjar | – Heatmaps- Session recordings | Google Analytics, HubSpot, WordPress | $40/month | Understanding user interactions and feedback |
| Microsoft Clarity | – Session replays- Heatmaps | Google Analytics | Free | Visualizing user behavior with heatmaps and recordings |
| Tableau | – Advanced visualization- Interactive dashboards | Salesforce, Google Analytics, databases | $15/user/month | Powerful data analysis and reporting |
| Mixpanel | – User analytics- Funnel tracking | Segment, Zapier, data warehouses | Free basic | Analyzing user engagement and retention |
| Heap.io | – Auto event tracking- Retroactive data analysis | Salesforce, HubSpot, data warehouses | Free (Quotation for paid) | Tracking user behavior without manual tagging |
| Voluum | – Ad tracking- Real-time reporting | Traffic sources, affiliate networks | $149/month | Performance tracking for affiliate marketing |
8 Best Analytics Tools for Agencies to Deliver Results and Drive Growth
To find the best analytics tools for agencies, we evaluated reporting accuracy, data visualization, integrations, automation, ease of use, and pricing. After testing 33 popular platforms, we’ve shortlisted the top 8 to help agencies track performance and drive data-driven results.
AgencyAnalytics
As the name suggests, AgencyAnalytics is designed specifically for agencies. It offers automated reporting and a real-time dashboard to streamline performance tracking and client communication.
The platform’s perfect for validating your work to your clients so that they know they’ve made the right decision in choosing your agency. With automated client reporting, you can schedule reports pulling live data from SEO, PPC, social media, and email campaigns.
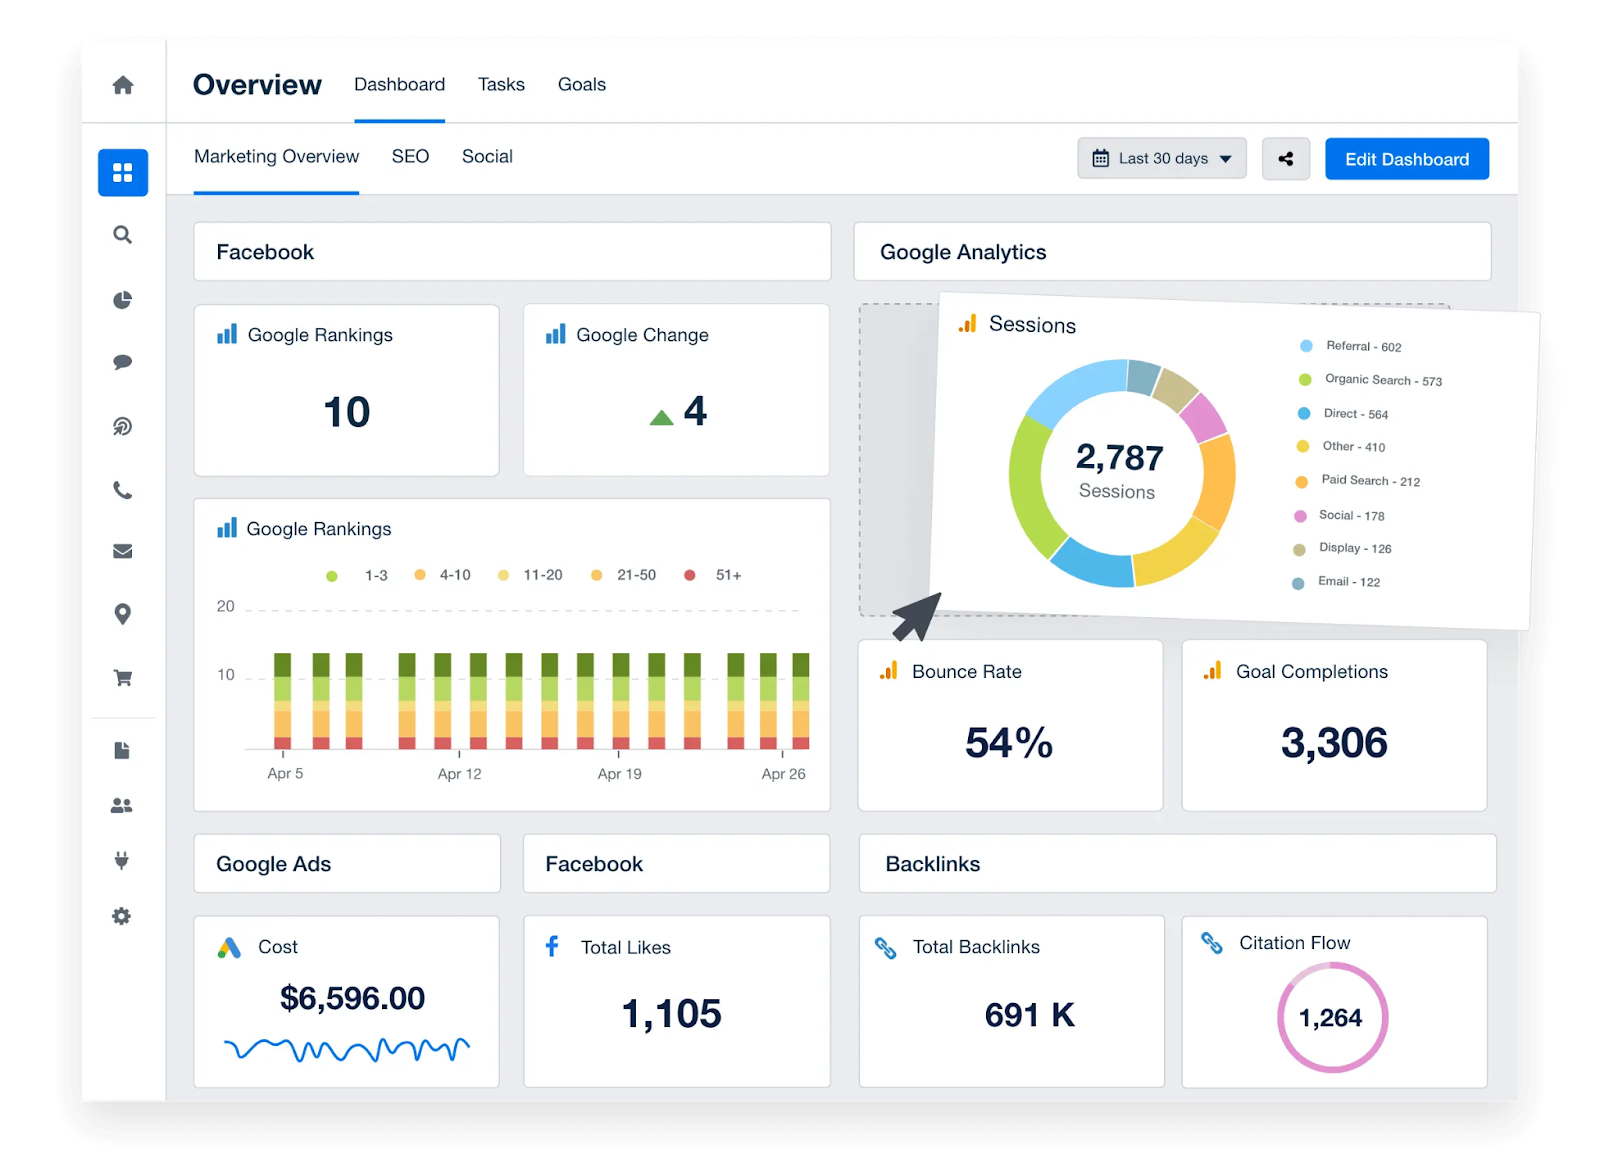
AgencyAnalytics integrations include over 80 platforms. The best of these are Google Analytics 4, Gravity Forms, and HighLevel. It’s what you need to track all key performance metrics in one place.
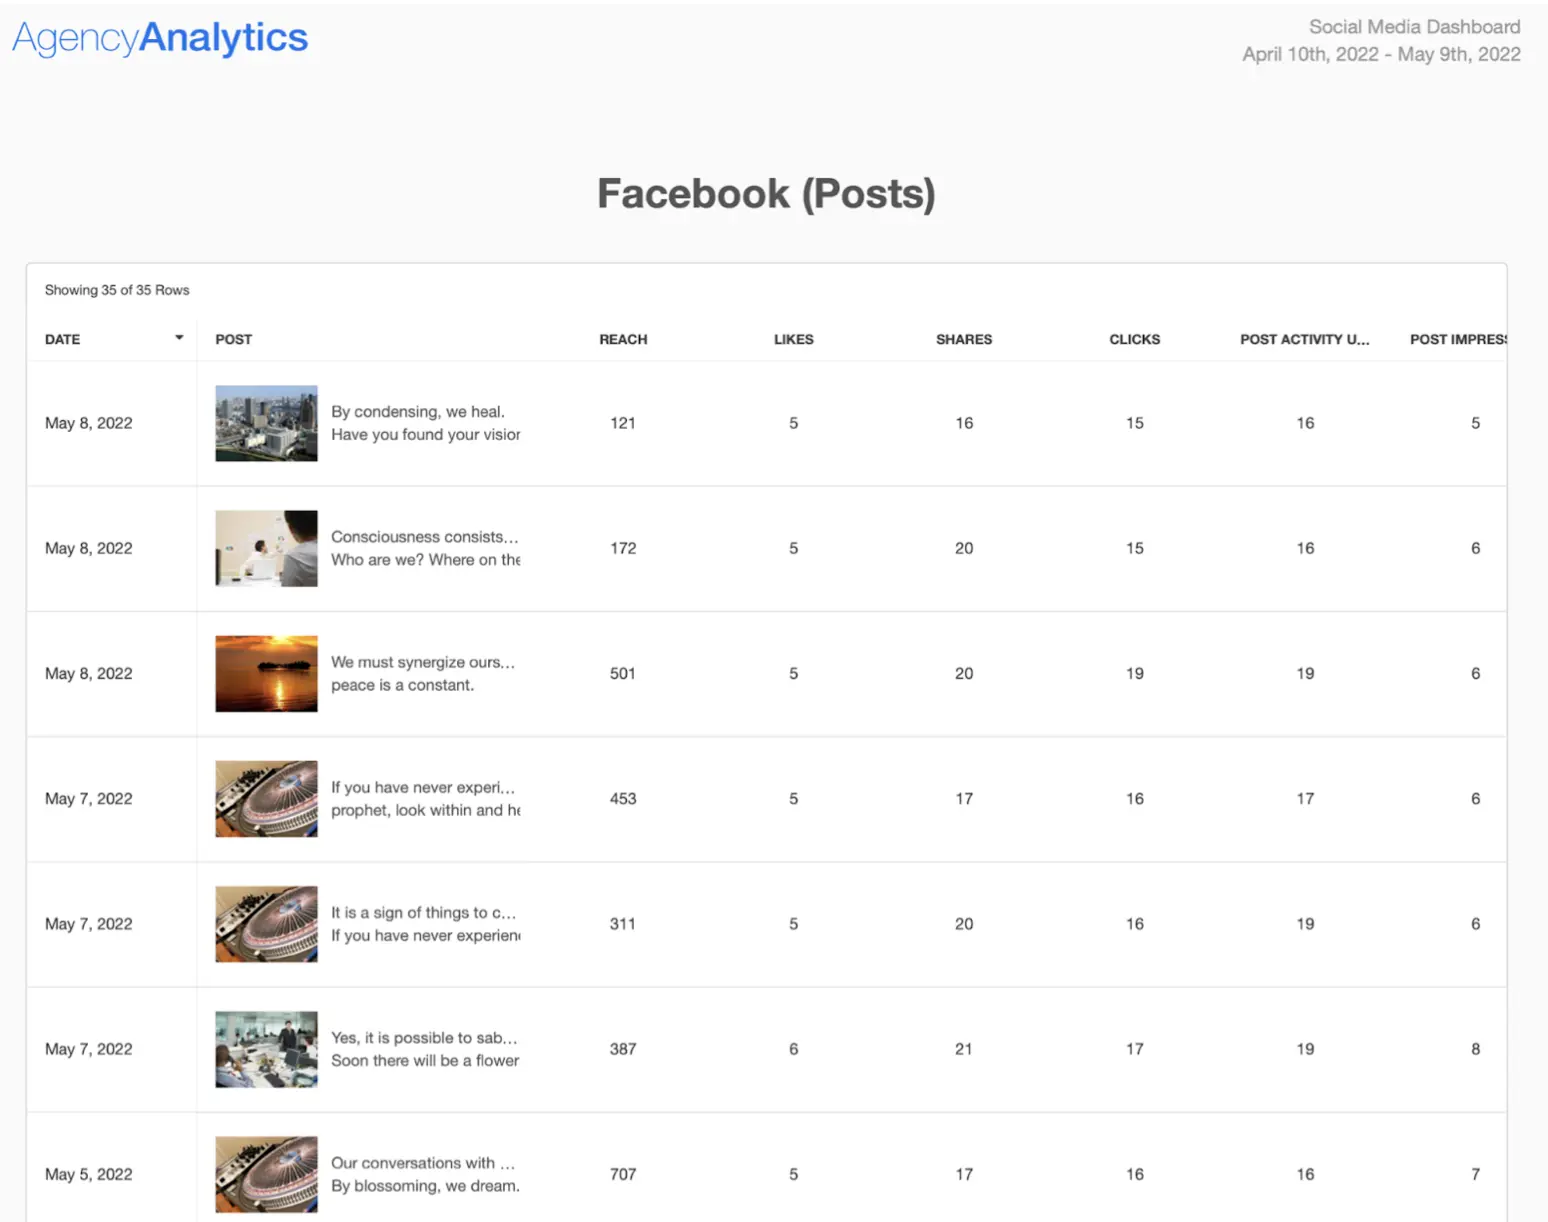
Moreover, it enhances efficiency by eliminating manual updates, ensuring clients receive timely, data-driven reports without extra effort. What’s more great is that the reports are completely white-labeled, strengthening your brand image.
Furthermore, the client portal gives your clients access to real-time dashboards with instant access to their data. This means your clients can access the information they need anytime.
Overall, it’s a great tool that uses automation right and takes as little effort as possible to create insightful client reports.
Key Features of AgencyAnalytics
AgencyAnalytics provides a wide range of features that simplify marketing analytics and client reporting. Here are the key capabilities:
- Customizable Dashboards: Create personalized dashboards that showcase the metrics clients care about most. Choose from prebuilt templates or design your own layouts.
- White-Label Reporting: Deliver white-labeled reports with your agency’s branding, including logos, colors, and custom headers, to maintain professionalism and consistency.
- Integrations with 60+ Tools: Connect with Google Ads, Facebook, SEMrush, HubSpot, and more, merging data from diverse marketing platforms into a single interface.
- Automated Reports: Schedule and automate report delivery, ensuring clients receive updates on time without manual intervention.
- SEO Tools: Track keyword rankings, backlinks, and site audits to optimize search engine performance.
- PPC and Social Media Analytics: Monitor ad performance, ROI, and engagement metrics from platforms like Google Ads, Facebook Ads, and LinkedIn.
- Call Tracking Integration: Analyze call data to measure the impact of campaigns that drive phone inquiries.
- Real-Time Data Updates: Get up-to-date insights to make faster, data-driven decisions.
- User Management: Assign roles and permissions to team members, ensuring secure and efficient collaboration.
- Client Portal: Offer clients a self-service portal to access their campaign data and reports in real-time.
Pros of AgencyAnalytics
- Custom dashboards fit client needs.
- White-label reports reinforce branding.
- Integrates with 60+ marketing tools.
- Automated reports reduce manual work.
- Real-time updates enable quick decisions.
Cons of AgencyAnalytics
- Lacks advanced visualization like Tableau.
AgencyAnalytics Pricing
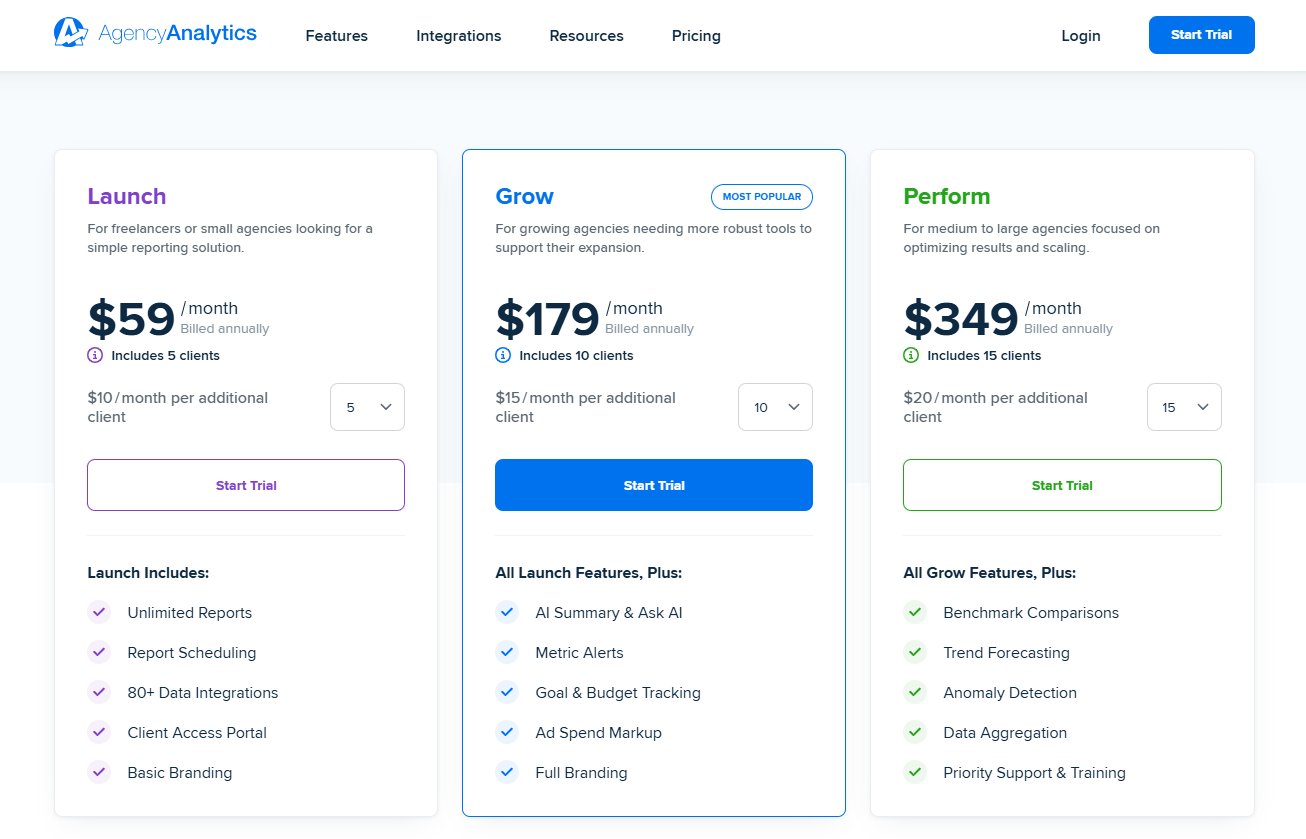
AgencyAnalytics offers three pricing plans:
- Launch ($59/month, 5 campaigns),
- Grow ($179/month, 10 campaigns),
- Perform ($349/month, 15 campaigns).
What Users Say About AgencyAnalytics?
Rating on Capterra: 4.8 out of 5
“The Best Agency Management Software Period!
Pros: Covers virtually all the bases for tracking and reporting metrics to clients. Whitelabel is awesome with custom domain support. Keyword tracking is precise and includes separate maps and mobile rankings. New custom dashboard feature is nice and easy to customize.
Cons: Keywords can add up so you have to keep your tracking lean.” – Christopher B.
2. Google Analytics
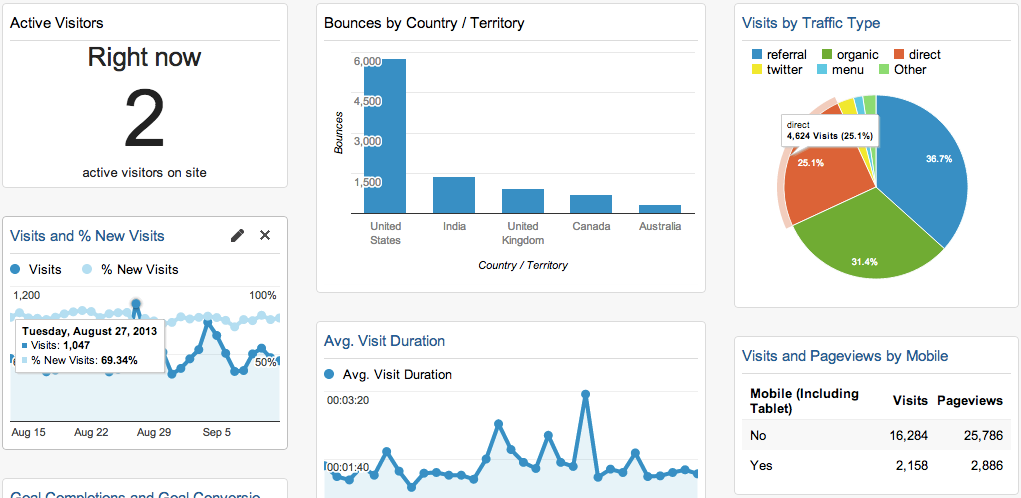
If you’re running an agency, Google Analytics is a must-have for tracking website traffic, user behavior, and campaign performance.
It helps you measure success, optimize strategies, and prove ROI with real-time tracking and detailed reports. This gives your clients clear, data-backed insights.
With GA4, you can track users across websites and mobile apps, ensuring you get a full picture of their journey. Advanced audience segmentation lets you identify high-value users, create personalized campaigns, and improve targeting.
Plus, AI-powered predictive analytics helps you anticipate trends, such as purchase likelihood or churn risk, so you can adjust strategies before it’s too late.
Another amazing benefit is that Google Analytics integrates seamlessly with Google Ads, Search Console, and Looker Studio. It gives you insight into SEO, PPC, and social media campaigns in one place.
Simply put, Google Analytics gives your agency the data you need to optimize campaigns, maximize budgets, and deliver results your clients can trust. All of it, for free.
Key Features of Google Analytics:
Google Analytics features that empower agencies with advanced data insights. Here are the top features:
Cross-Platform Tracking
Google Analytics provides a comprehensive view of user behavior across devices and platforms. By tracking interactions on mobile, desktop, and tablets, agencies can understand the full customer journey.
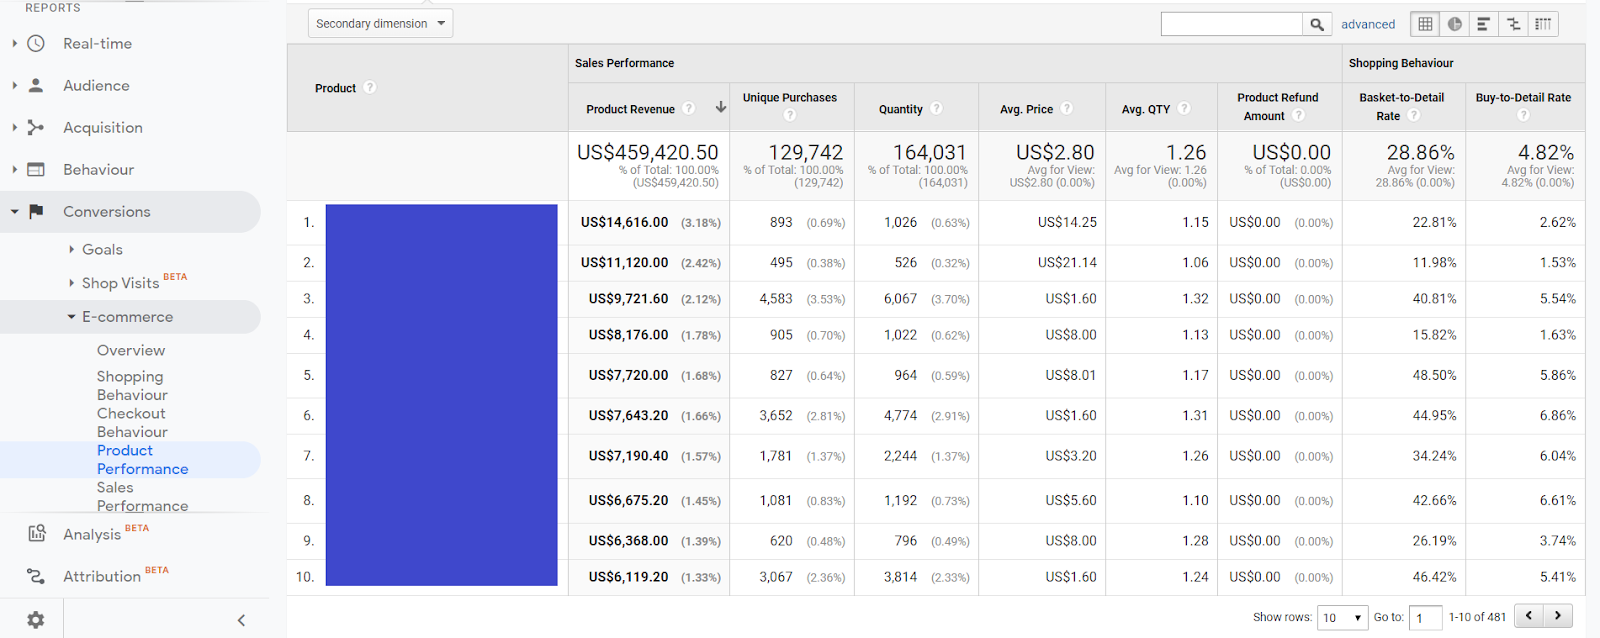
Enhanced Ecommerce Tracking
For agencies managing online stores, this feature offers detailed insights into product performance, shopping behavior, and checkout processes. It helps identify drop-off points and opportunities to improve conversion rates for ecommerce clients.
Custom Dimensions and Metrics
Agencies can define custom dimensions and metrics to track unique data points specific to their client’s goals. This flexibility allows for deeper analysis of niche KPIs, such as tracking user engagement with specific content or features.
Data Studio Integration
Google Analytics seamlessly integrates with Google Data Studio, enabling agencies to create visually appealing, interactive reports. This feature simplifies the process of presenting complex data to clients in an easy-to-understand format.
Attribution Modeling
Understanding which marketing efforts drive conversions is easier with Google Analytics’ attribution models. Agencies can compare different models, like first-click or linear attribution, to determine the most effective strategies.
Event Tracking
Event tracking allows agencies to monitor specific user interactions, such as video plays, button clicks, or downloads. This granular data helps refine client campaigns by identifying what engages users most effectively.
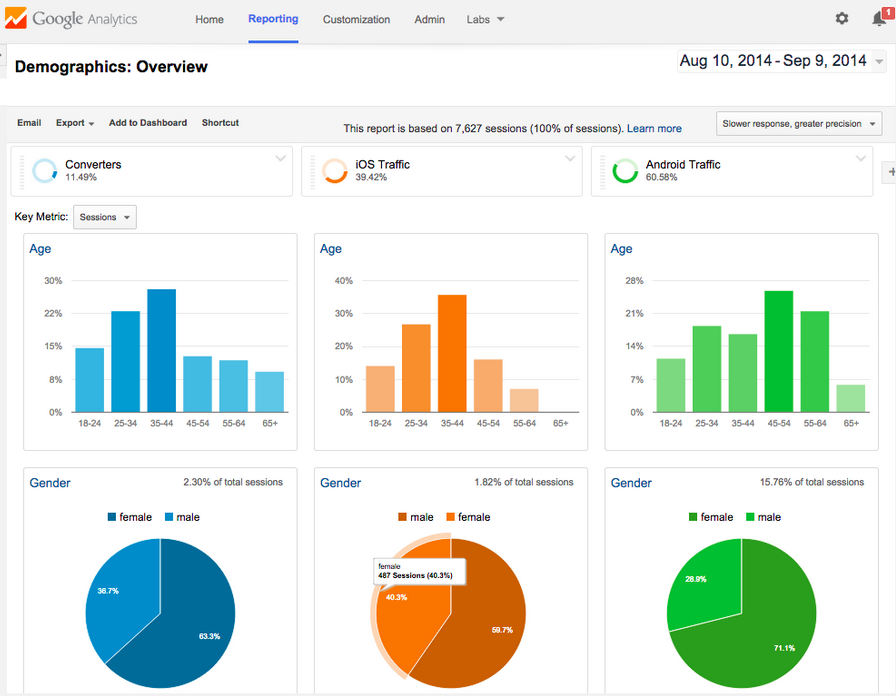
Audience Insights and Demographics
Google Analytics provides detailed demographic data, including age, gender, and interests of website visitors. Agencies can leverage this information to create targeted campaigns that resonate with the right audience segments.
Automated Anomaly Detection
Using machine learning, Google Analytics can automatically detect unusual spikes or drops in data. This feature helps agencies quickly identify and address potential issues, ensuring clients’ campaigns remain on track.
Pros of Google Analytics
- Free access to powerful analytics tools.
- Deep insights into user behavior trends.
- Seamless connection with Google marketing tools.
- Advanced audience segmentation for targeting.
- E-commerce insights to boost conversions
Cons of Google Analytics
- Short data retention restricts historical analysis.
Google Analytics Pricing:
Google Analytics offers two pricing plans: Standard (Free) with essential tracking and reporting features, and Analytics 360 (Custom Pricing).
What Users Say About AgencyAnalytics?
Rating on G2: 4.5 out of 5
“Still a good (and free) analytical platform
What do you like best about Google Analytics?
Ease of setup for Shopify stores, a library of pre-set reports ready to use, Google Ads integration, and insights from the Google Search Console.
What do you dislike about Google Analytics?
Lots of features that were a staple in Universal Analytics do not exist in GA4 (like sales by day of week/hour of day report). GA4 is supposed to be user-friendly but it is not. Still grieving the loss of Universal Analytics. And don’t even get me started on the colouring scheme of all graphs! Why are they all of almost the same colour?” – Anna O.
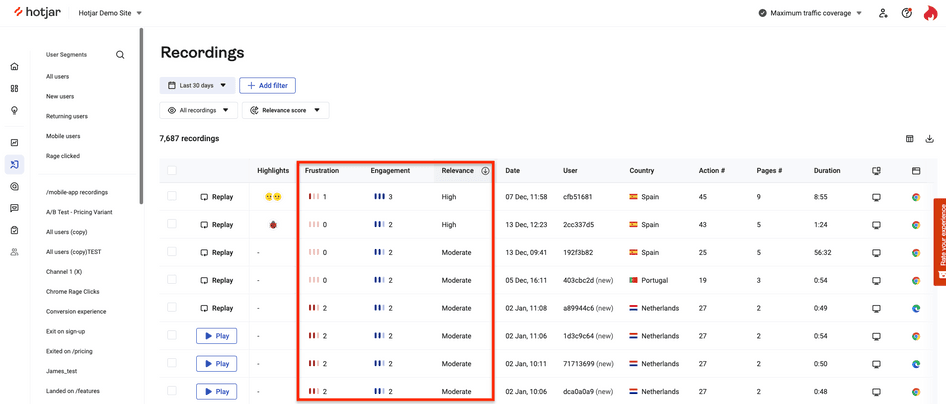
3. Hotjar
Hotjar stands out by turning raw user data into actionable insights. It shows why users behave the way they do and empowers you to optimize client websites with precision.
With heatmaps and session recordings, you can see exactly where users struggle, helping you eliminate friction points that lead to drop-offs.
Live feedback tools and surveys let you capture real-time user sentiment, so you can address concerns before they impact retention. These features ensure your clients’ websites are not just functional but truly user-friendly.
As a top AgencyAnalytics alternative, Hotjar gives you more extensive qualitative insights. Its session recordings let you watch real user journeys. While AgencyAnalytics shows engagement stats and focuses on performance metrics. It’s limiting when it comes to taking action to fix usability issues.
Overall, if you want to drive customer retention and long-term success for your clients, Hotjar provides the insights you need to make it happen.
Key Features of Hotjar:
Hotjar features provide agencies with deep user behavior insights, visual data, and actionable feedback to optimize client websites and campaigns.
Heatmaps
Heatmaps visually represent user interactions, highlighting areas with the most clicks, taps, and scrolls. Agencies can use this tool to pinpoint high-engagement areas and detect elements that users overlook.
Session Recordings
By capturing real user sessions, Hotjar allows agencies to watch how visitors interact with a website. These recordings often reveal hidden usability issues, such as confusing navigation or unresponsive buttons, that traditional analytics might miss.
Surveys and Feedback Polls
Agencies can collect direct feedback from users through customizable surveys and polls. Gathering this type of qualitative data helps agencies understand user satisfaction levels and identify specific pain points to address.
Conversion Funnels
Hotjar’s funnel analysis to track where users drop off during a conversion process. Identifying these drop-off points allows teams to focus on optimizing specific steps, ultimately improving conversion rates for clients.
Incoming Feedback
With the incoming feedback feature, users can leave visual feedback by clicking on any part of a webpage. Agencies benefit from this direct input, as it highlights specific elements that frustrate or delight users, guiding targeted improvements.
User Testing (Hotjar Engage)
Hotjar Engage allows agencies to recruit and conduct user testing sessions with real people. Observing these sessions provides first hand insights into user behavior, helping agencies make data-backed recommendations for website enhancements.
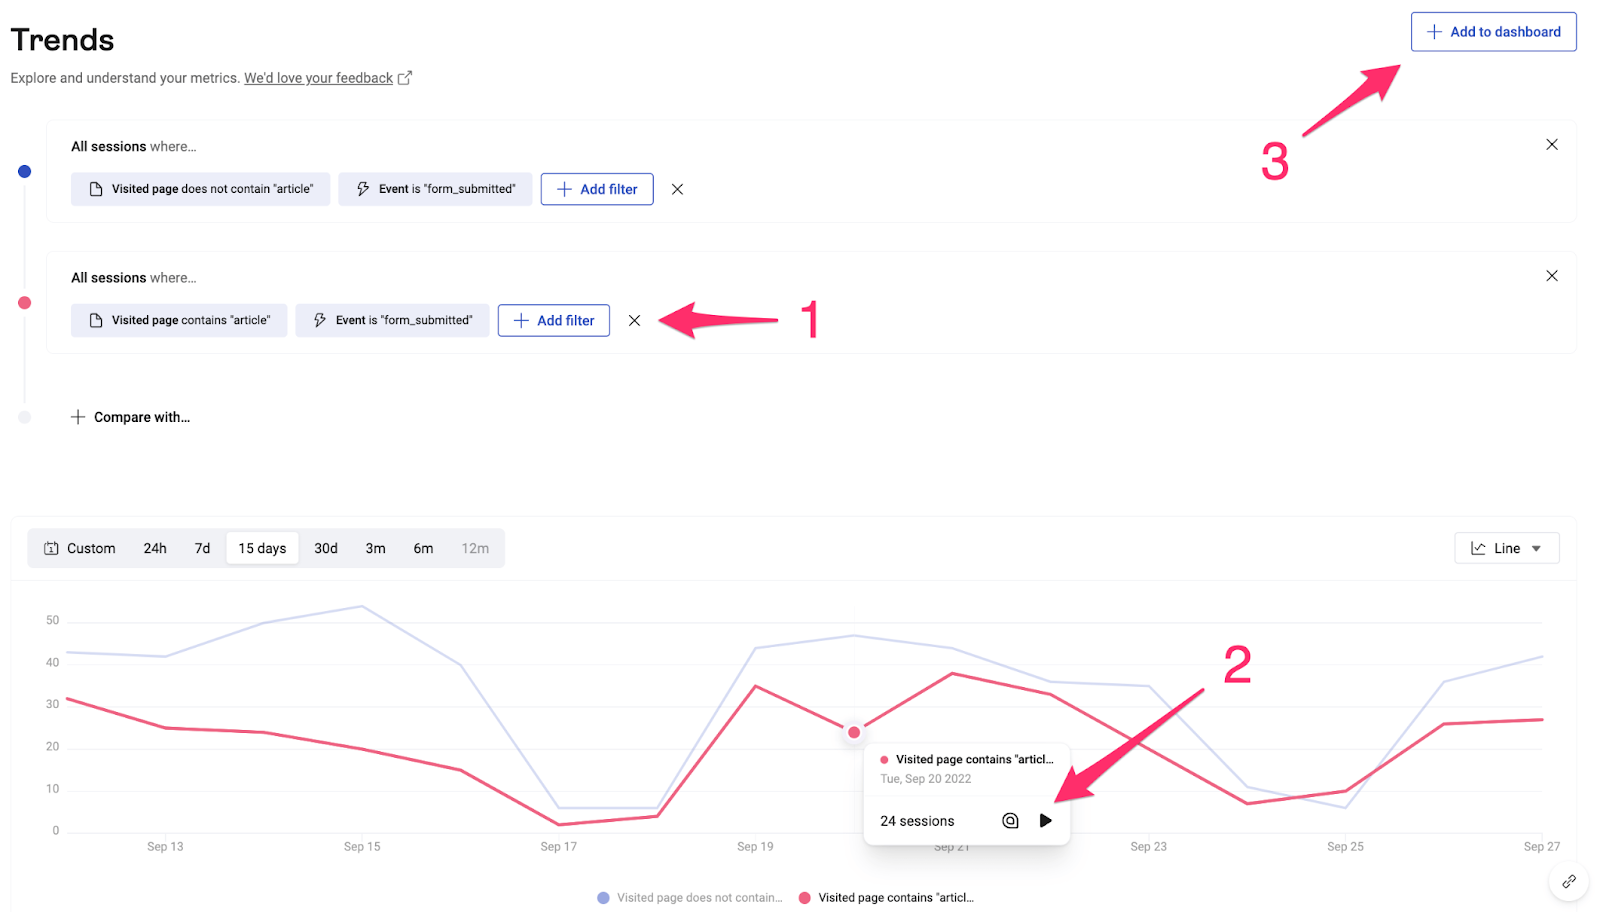
Trend Analysis
Trend analysis tools help agencies track changes in user behavior over time. Monitoring these trends in heatmaps, recordings, or survey responses allows teams to measure the effectiveness of their optimizations.
Hotjar Pros:
- Heatmaps reveal user engagement hotspots.
- Session recordings identify usability issues.
- Conversion funnels highlight drop-off points.
- Form analytics improve submission rates.
- Easy integration with existing platforms.
Hotjar Cons:
- Potential website performance impact reported.
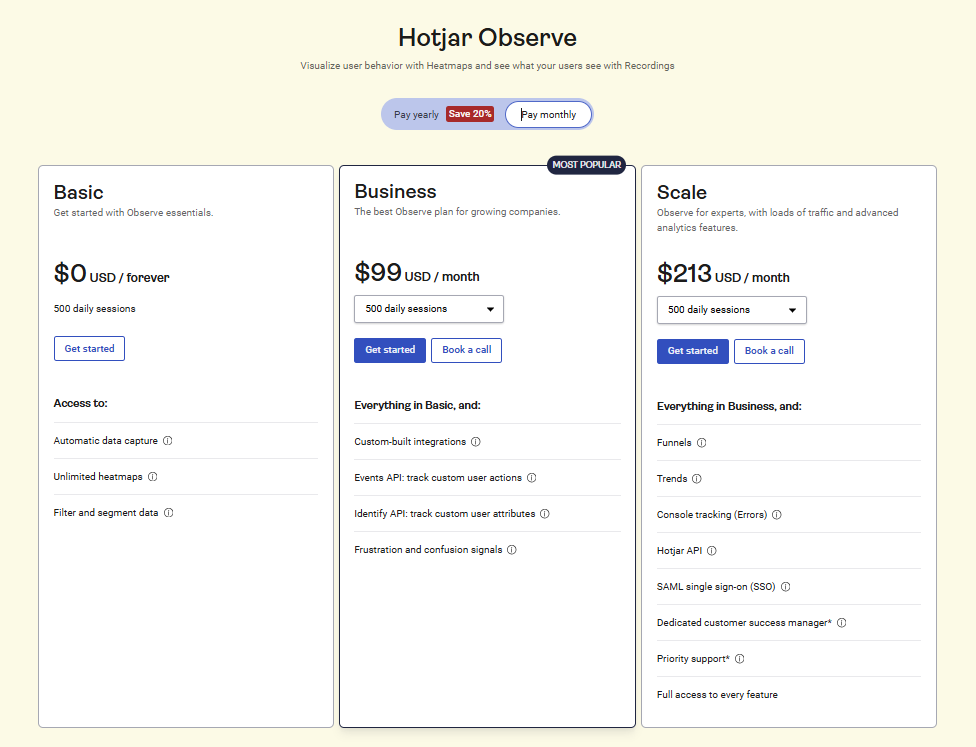
Hotjar Pricing:
Hotjar provides four pricing tiers: Free, Plus, Business, and Scale. The Free plan offers basic features at no cost. The Plus plan starts at $39 per month, the Business plan at $99 per month, and the Scale plan is available upon contacting sales.
What Users Say About Hotjar?
Rating on G2: 4.3 out of 5
“Powerful Tool for User Insights
What do you like best about Hotjar?
Hotjar is incredibly intuitive, offering valuable heatmaps, session recordings, and feedback tools that help us better understand user behavior and improve our website performance.
What do you dislike about Hotjar?
Sometimes session recordings are slow to load.” – Sidra A.
4. Microsoft Clarity
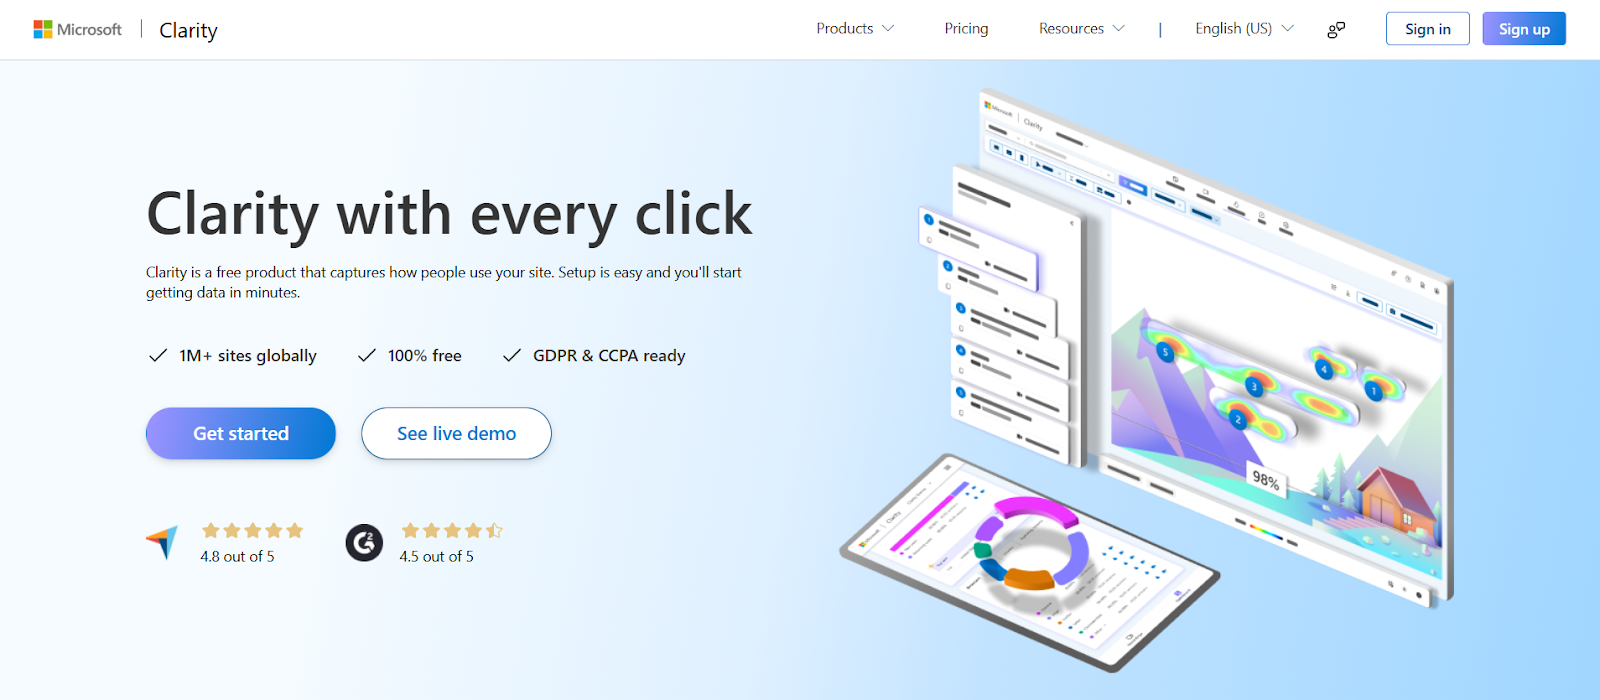
Microsoft Clarity is a blessing for smaller companies that use analytics. It’s a free forever platform and gives you a deep understanding of how users interact with your website.
With detailed session recordings, you can pinpoint exactly where users struggle. It can be confusing navigation, unresponsive elements, or friction in the journey.
Moreover, heatmaps provide clear visual data on where users click, scroll, and linger the most. If key content or CTAs are being ignored, heatmaps highlight areas that need attention. Clarity ensures that every design choice is backed by real user behavior.
Click maps and scroll maps offer even more granular engagement insights, while rage click detection narrows down unresponsive elements in your website.
However, Clarity lacks some additional tools that Hotjar offers like feedback widgets, surveys, user interviews, and funnels.
Having said that, Microsoft Clarity delivers essential analytics without any added costs. With privacy compliance and seamless integration, it’s a powerful, cost-effective choice for agencies.
Key Features of Microsoft Clarity:
Microsoft Clarity equips agencies with the following powerful analytics tools designed to uncover user behavior patterns and improve engagement:
Session Recordings
Experience real-time replays of user interactions, allowing you to identify navigation issues and optimize the user journey. This feature captures every click and scroll, providing a comprehensive view of user behavior.
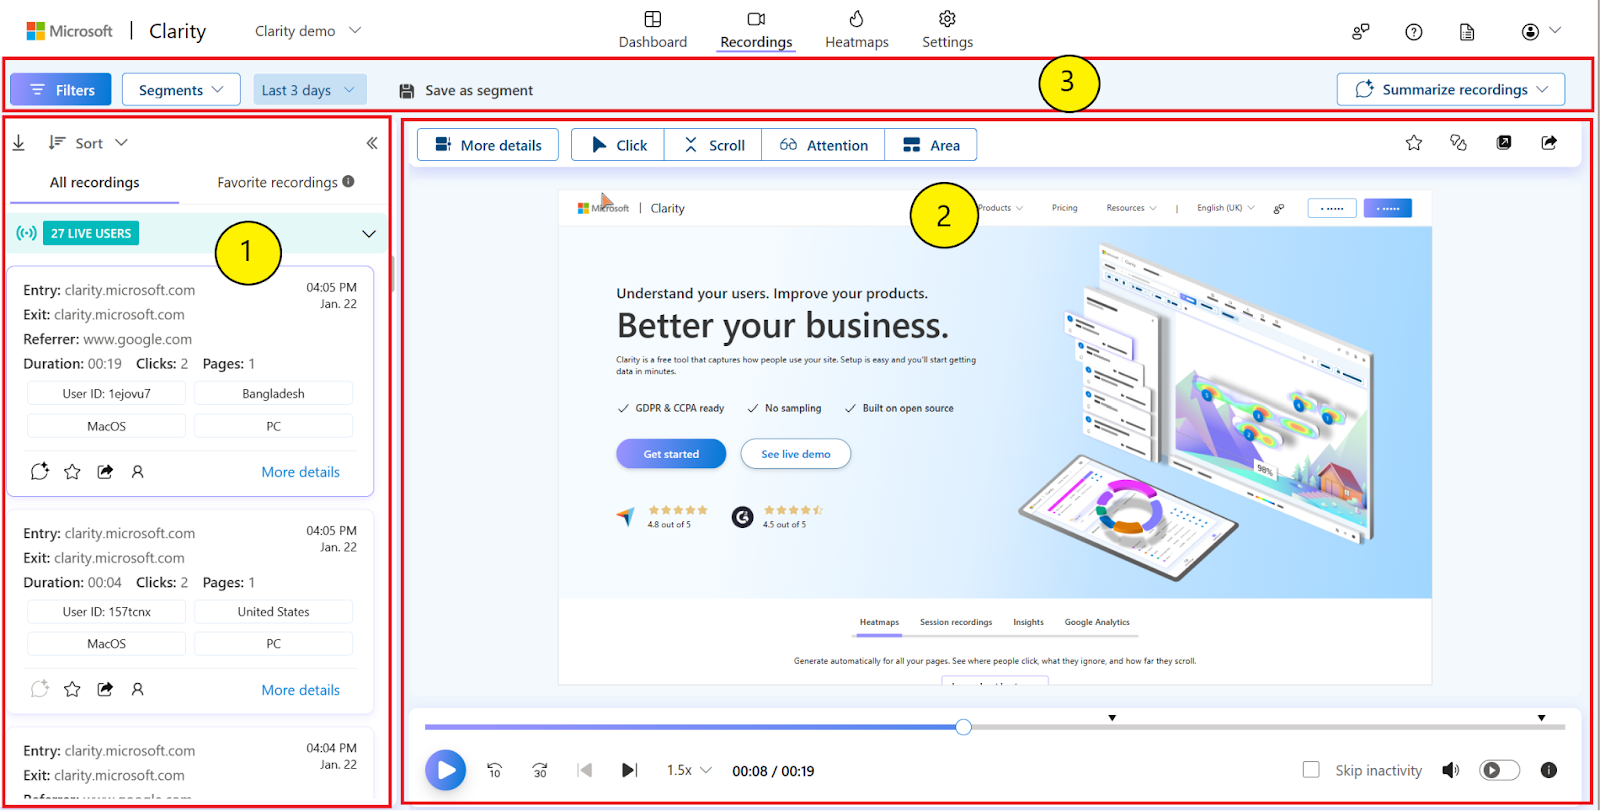
Heatmaps
Visualize user engagement through heat maps that highlight areas of interest and neglect. By analyzing click, scroll, and area heatmaps, you can determine which sections of your site attract or lose user attention.
Rage Click Detection
Automatically identify instances where users rapidly click on elements, indicating frustration. This insight helps pinpoint problematic areas that may hinder user experience.
Dead Click Identification
Detects clicks on non-interactive elements, revealing user confusion. Understanding these interactions allows for adjustments to improve site intuitiveness.
Scroll Maps
Assess how far users scroll on your pages to determine content visibility. This data aids in optimizing content placement and length for better engagement.
Custom Tags
Implement custom tags to categorize user actions and events specific to your site’s goals. This customization facilitates targeted analysis and reporting.
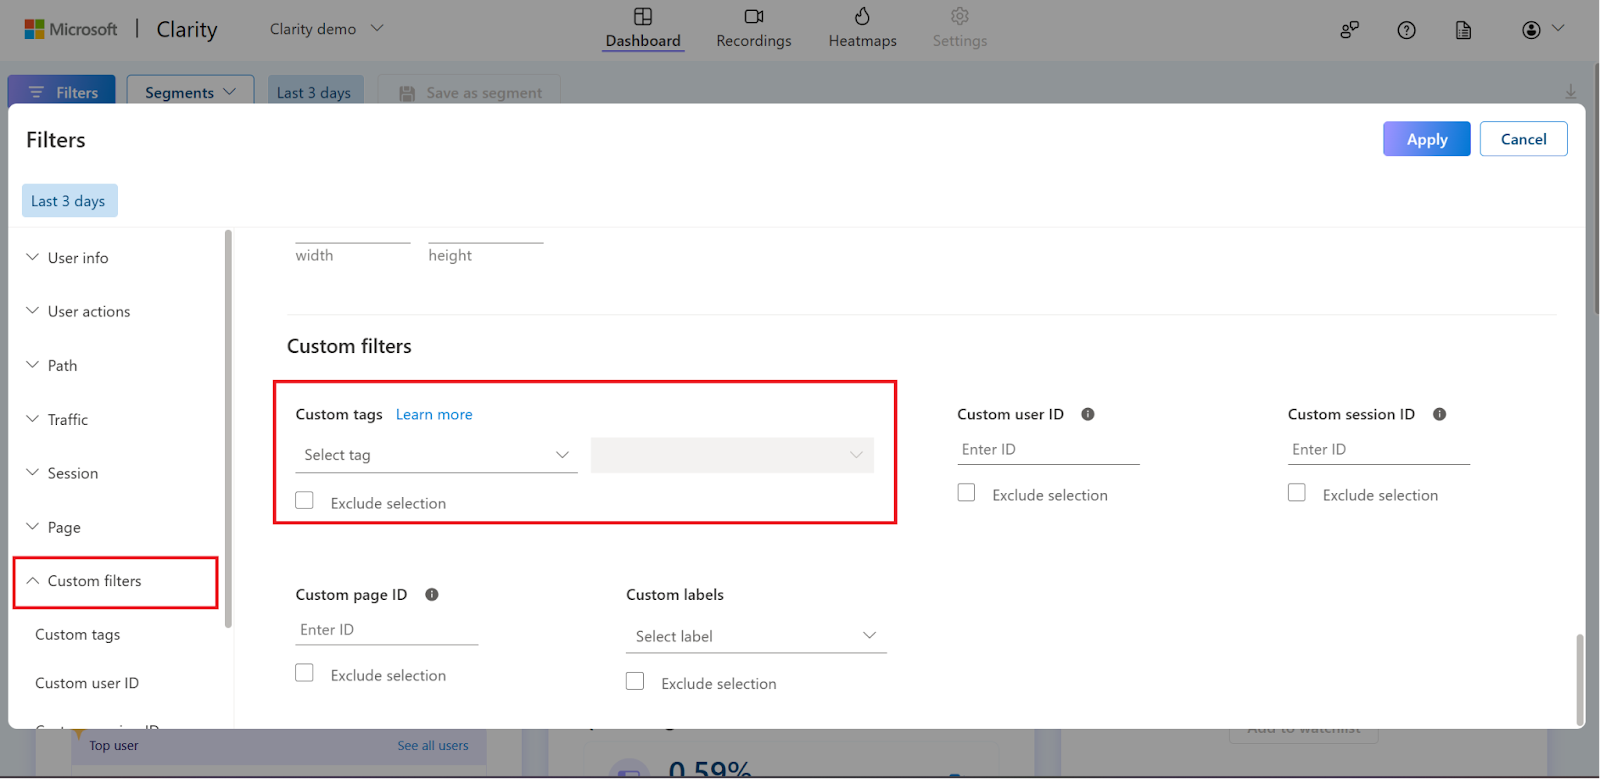
Segmentation and Filtering
Utilize over 40 filters to segment data based on user behavior, session attributes, and traffic sources. Saving these filters as segments allows for quick re-application across analyses.
Copilot Insights
Leverage AI-driven insights with Copilot to quickly summarize session recordings and heatmaps. This feature accelerates data analysis, providing actionable recommendations.
Pros of Microsoft Clarity:
- Free to use without limitations.
- Integrates with Google Analytics seamlessly.
- Provides unlimited session recordings.
- Identifies rage clicks indicating user frustration.
- Low impact on website load speed.
Cons of Microsoft Clarity:
- No A/B testing tools available.
- Session recordings are only stored for 30 days.
Microsoft Clarity Pricing:
Microsoft Clarity offers a single, comprehensive plan that is entirely free.
What Users Say About Microsoft Clarity?
Rating on G2: 4.5 out of 5
“Good tool with a lot of filter options + nice Chrome extension
What do you like best about Microsoft Clarity?
Being able to add really specific filters for monitoring specific pages on website or elements on page. And it has a lot of good standard features
What do you dislike about Microsoft Clarity?
What I don’t really like is the way Microsoft does their UI in general. It’s kind of chaotic.
For example, the amount of filter options is impressive and really nice. But then they decided to displayed them sort of horizontally instead of vertically. But you could still scroll vertically to search for other filter categories.” – David V. K.
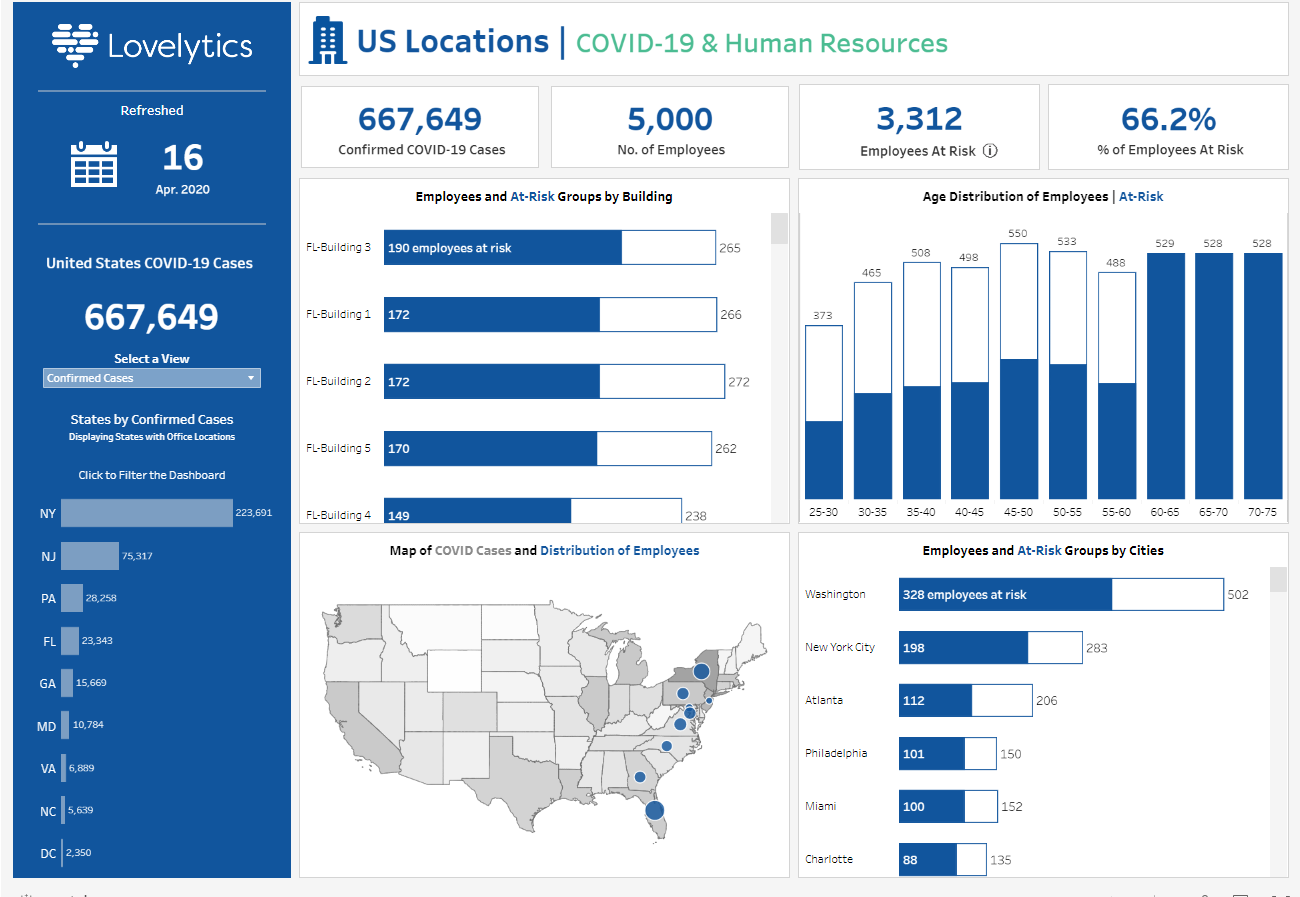
5. Tableau
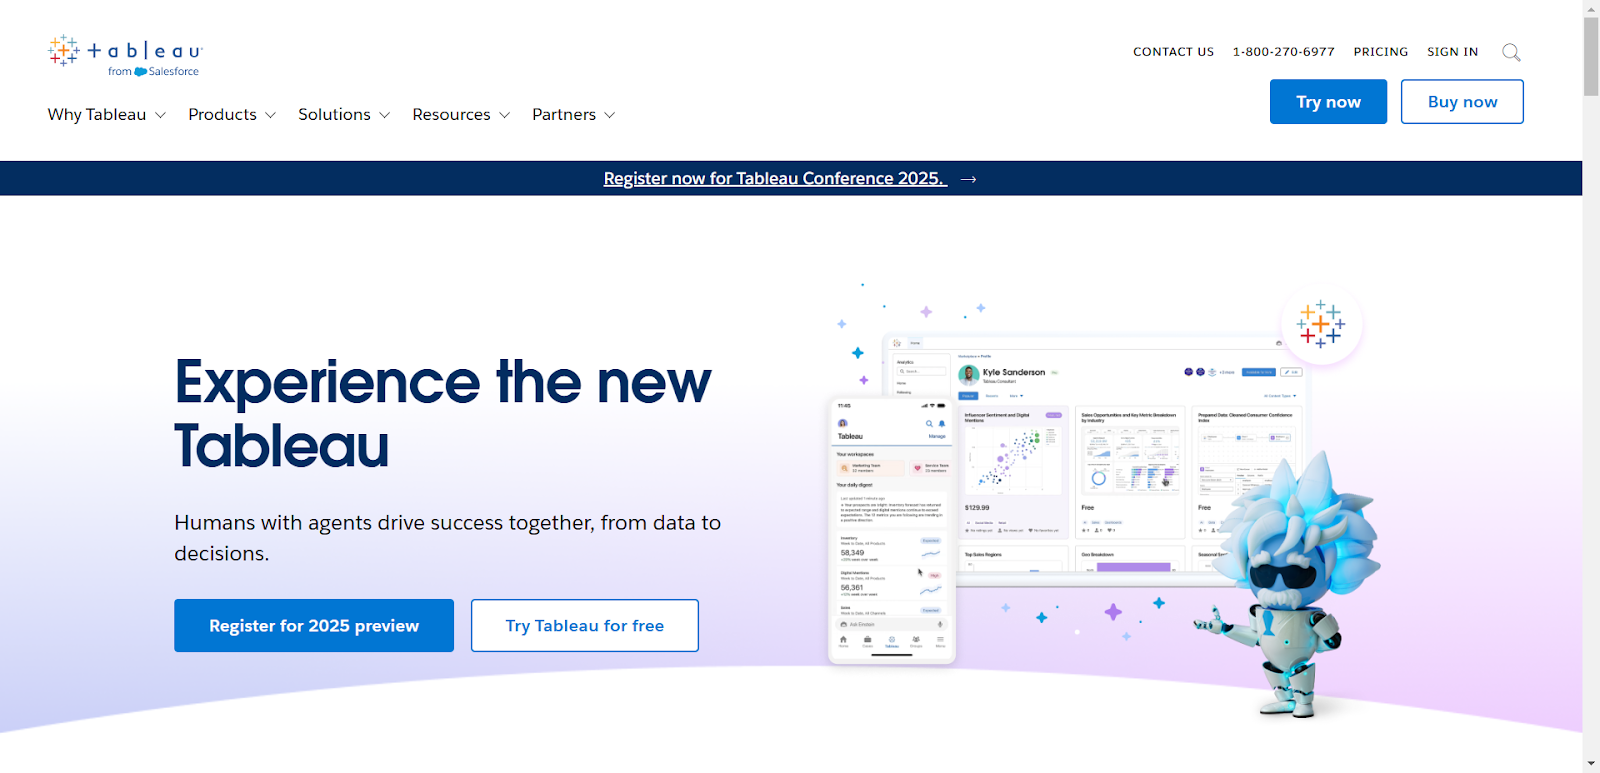
Tableau’s dynamic dashboards, real-time visualizations, and AI insights make it a powerful tool for agencies. It simplifies complex data into clear, actionable insights. Agencies can track client behavior, predict churn, and refine engagement strategies with precision.
One of its most powerful features is predictive analytics. By analyzing past trends, it forecasts future client actions. This allows agencies to take proactive steps in improving retention.
Moreover, its interactive dashboards deliver real-time insights. Agencies can monitor engagement levels and detect drop-offs early.
Unlike Microsoft Clarity, which focuses on session recordings and heatmaps for behavior analysis, Tableau provides advanced predictive analytics. Its AI-driven forecasting helps agencies anticipate client needs rather than just observing past interactions.
With deep analytics and automation, Tableau streamlines client acquisition strategies. Its advanced tools provide the clarity needed to drive long-term success. For agencies looking for a strong analytics solution, it definitely stands out.
Key Features of Tableau
Tableau provides a range of advanced features that empower agencies to visualize and analyze data effectively. Here are its standout features:
- Drag-and-Drop Interface: Intuitive drag-and-drop functionality makes it easy for users to create charts, graphs, and dashboards without coding knowledge.
- Interactive Dashboards: Agencies can build dynamic dashboards and so an easy analytics setup with filters, drill-downs, and visualizations.
- Real-Time Analytics: Tableau supports live connections to data sources, enabling real-time updates for dashboards and reports.
- Extensive Data Integration: The tool connects to a wide variety of data sources, including Excel, Salesforce, SQL databases, and cloud services like Google Analytics.
- Customizable Visualizations: From heat maps to scatter plots, Tableau offers a vast array of visual options, helping agencies present data in engaging and meaningful ways.
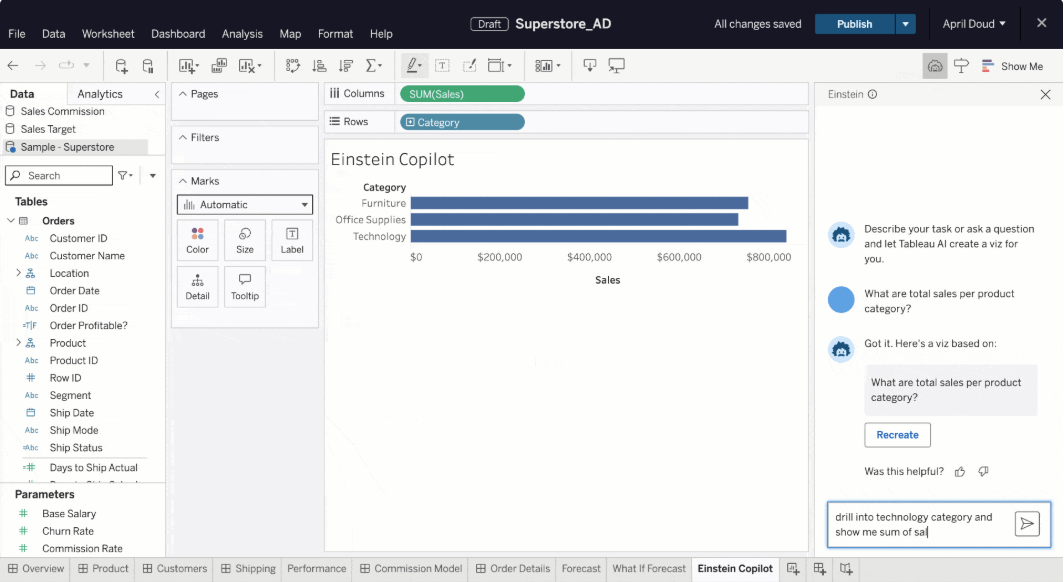
- Advanced Analytics with AI: Predictive analytics and AI-driven features like “Explain Data” make connections between complex data. It uncovers trends and insights hidden in complex datasets.
- Collaboration Tools: Teams can collaborate on dashboards and share them securely across the organization or with clients via Tableau Online or Tableau Server.
- Data Blending and Transformation: Users can combine data from different sources and clean it directly within Tableau for more accurate reporting.
Pros of Tableau
- Drag-and-drop interface for easy use.
- Connects with CRMs, databases, and the cloud.
- Real-time analytics for instant insights.
- Customizable dashboards and detailed reports.
- AI-driven predictions reveal hidden trends.
Cons of Tableau
- Manual data updates are needed occasionally
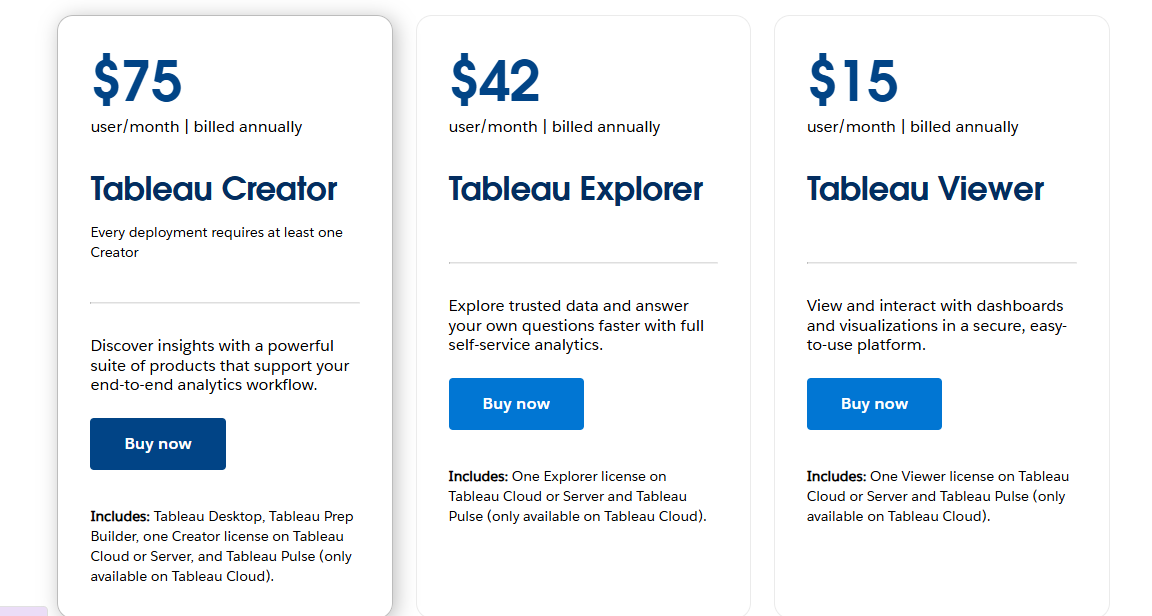
Tableau Pricing
Tableau offers three pricing tiers:
- Creator ($70/user/month)
- Explorer ($42/user/month)
- Viewer ($15/user/month), billed annually.
What Users Say About Tableau?
Rating on Capterra: 4.6 out of 5
“Tableau for Business Intelligence
Overall: Tableau overall is a very suitable software for data visualisation and business intelligence. It is easy to use and very interesting.
Pros: Easy to use. Industry standard. Value for money. Large community. Recognised certificates. A year free plan for Students and Instructors. Can handle huge size of data. Charts and Visualizations can be embedded on websites and other software like power point.
Cons: Tableau prep is not as easy to use as MS Excel.” – Samuel I.
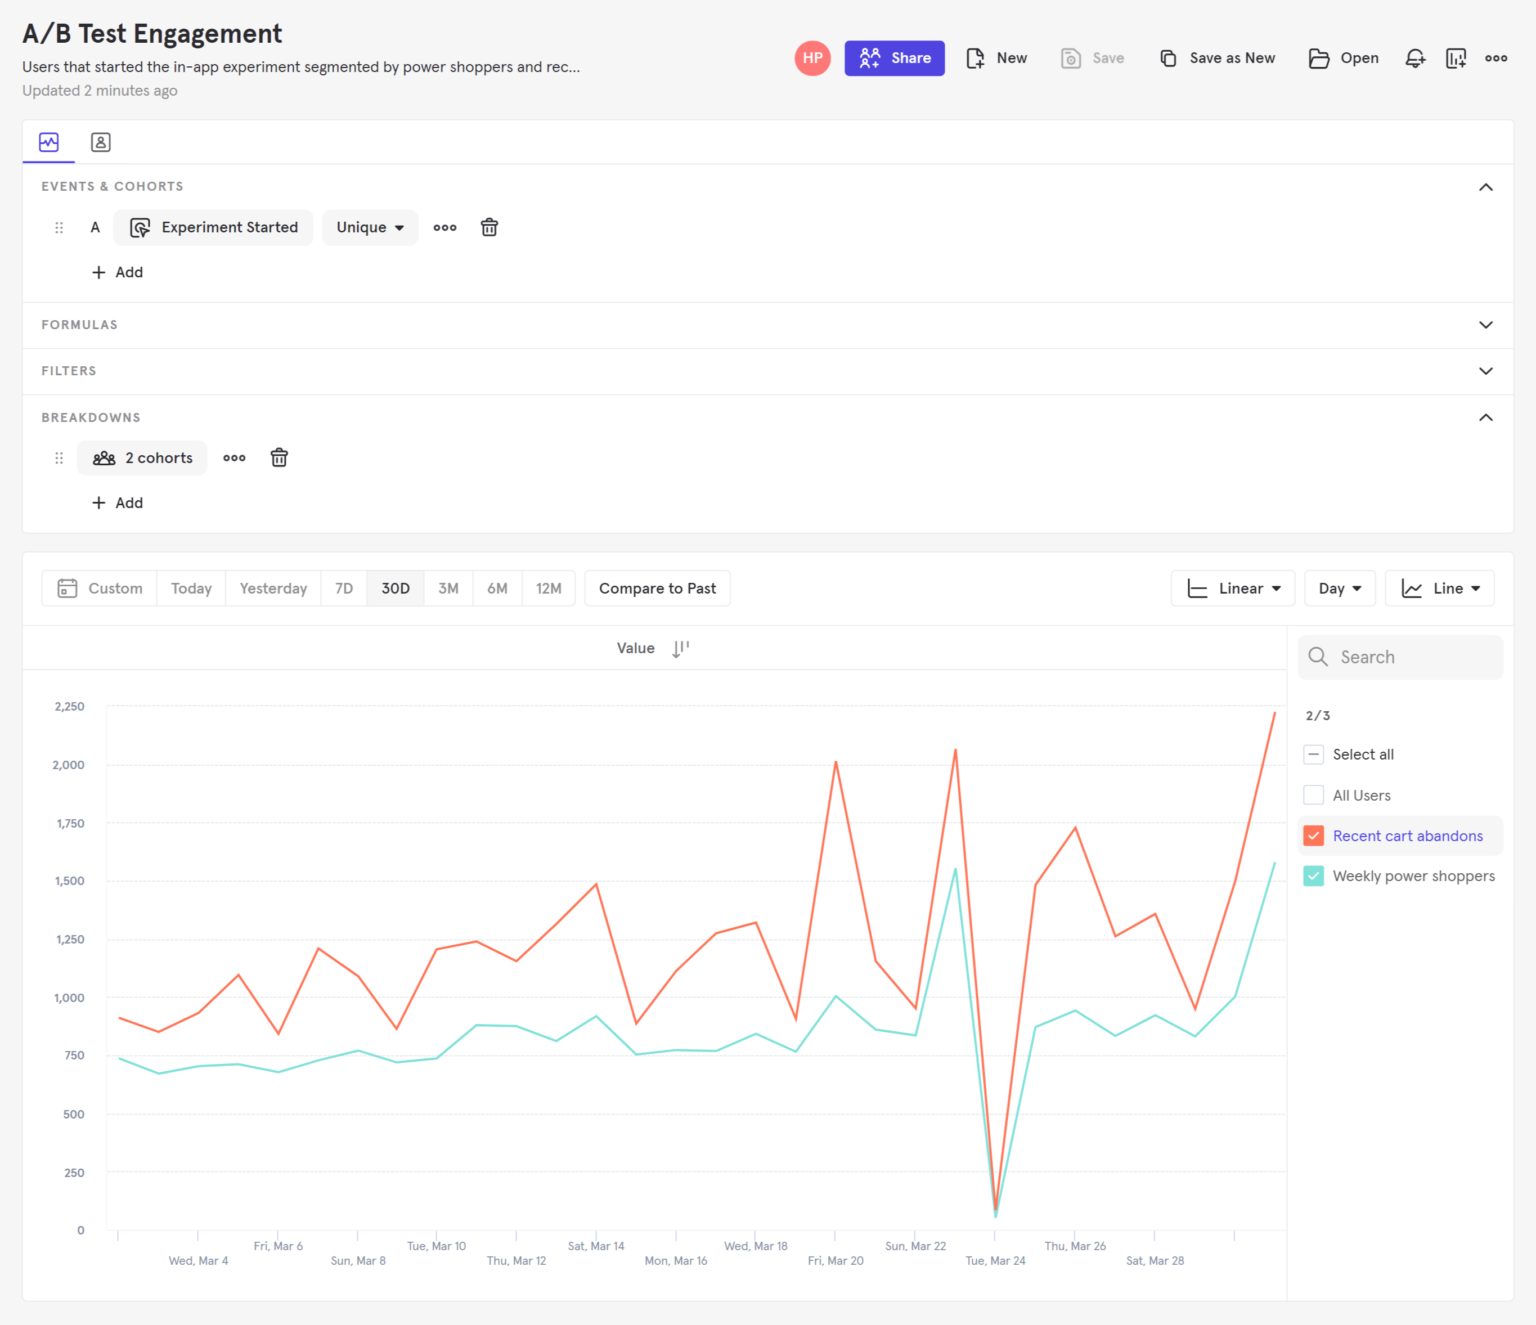
6. Mixpanel
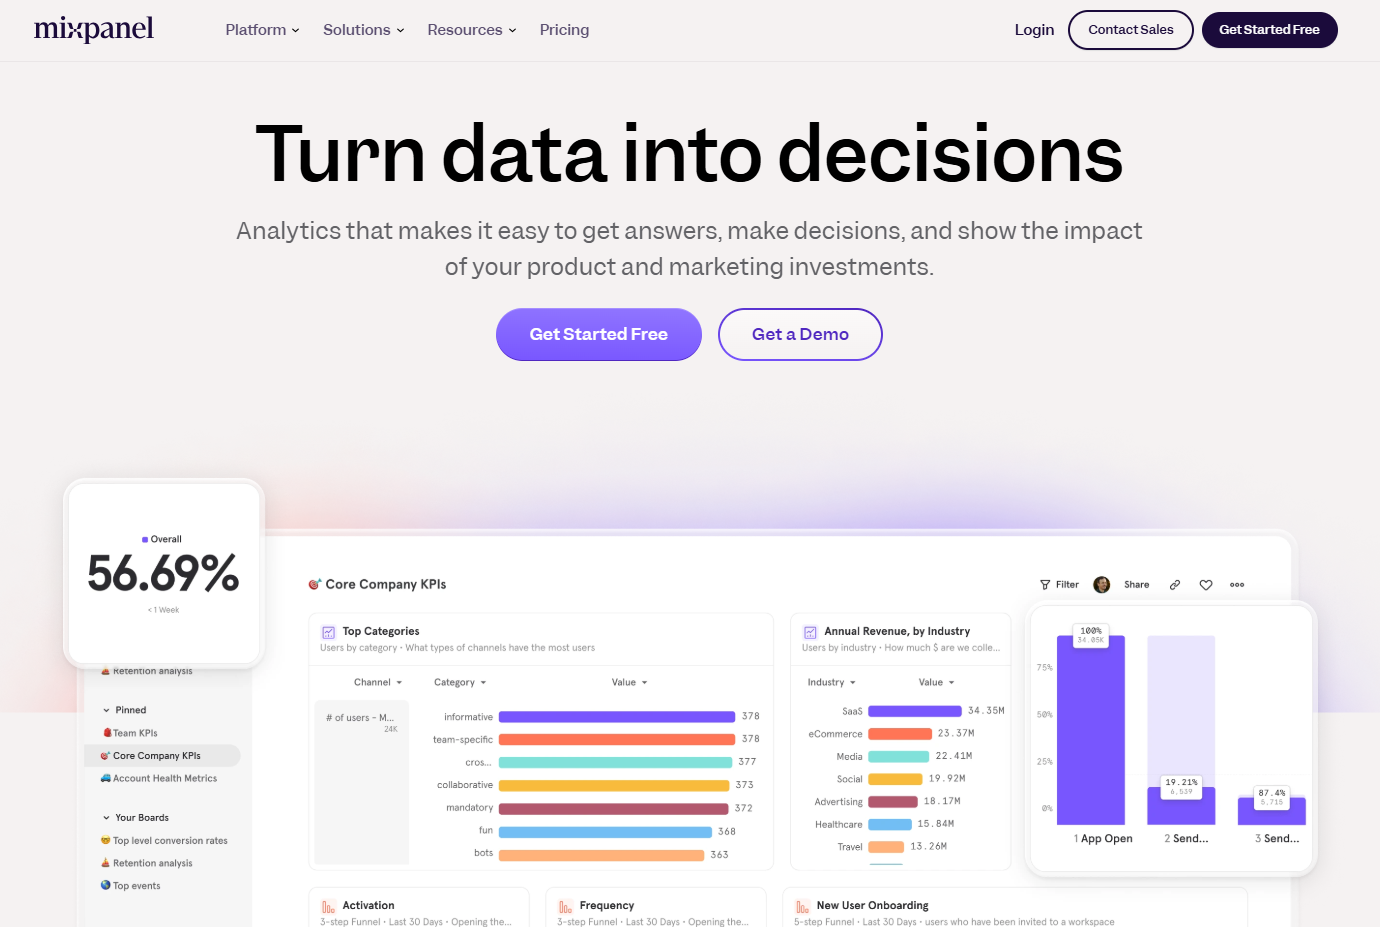
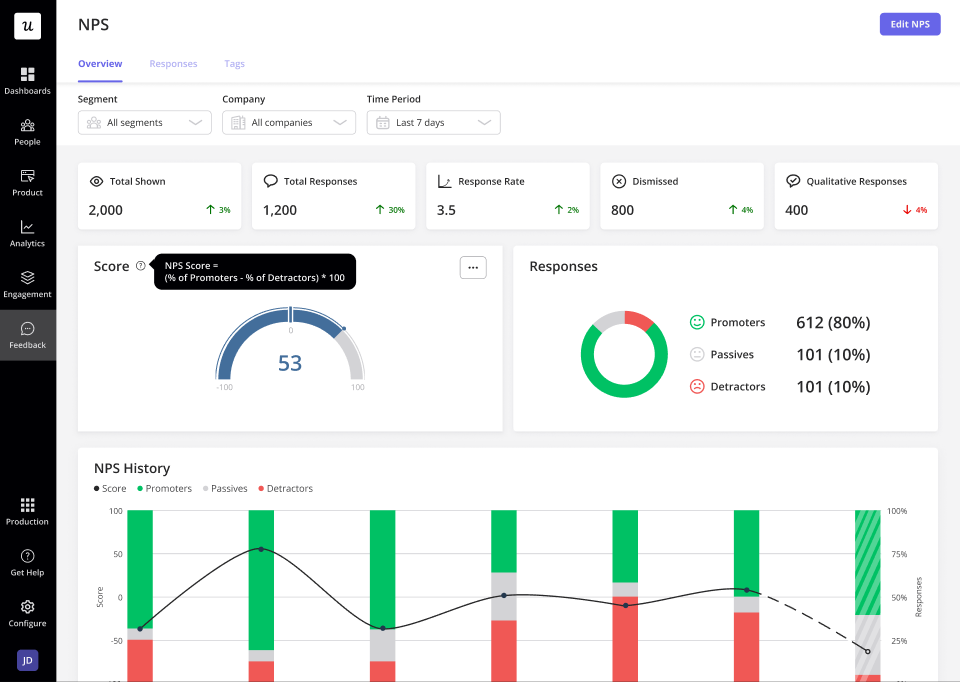
Mixpanel’s advanced retention analytics and user segmentation make it an exceptional tool for agencies aiming to improve customer retention.
With retention reports, you can assess user engagement over specified periods, understanding how long users continue to find value in your product. It’s an especially useful feature if you’re at the stage of finding a product-market fit.
Moreover, it allows flexible user segmentation. You can categorize users based on properties, cohorts, attribution, sources, locations, and behaviors. With such clear segmentation, you can optimize user experience and get what you care for most- conversions!
A way to further optimize user experience is the funnel analysis feature, which gives you actionable information. It identifies where and why users drop off during key processes. This pinpoints exactly where an improvement needs to be made.
In comparison, Tableau provides comprehensive data visualization tools, enabling in-depth analysis across diverse datasets. Mixpanel specializes in real-time event-based analytics, offering customizable charts and reports for immediate user behavior insights.
Key Features of Mixpanel:
Mixpanel features extensive analytics tools to deeply understand user behavior and drive product success. Here are the top ones:
Event-Based Tracking
At its core, Mixpanel captures user interactions as events, allowing for detailed analysis of user behavior within your product. It monitors specific actions, such as button clicks or feature usage, providing granular insights into user engagement.
Interactive Reports
Mixpanel offers interactive reports that let you query and visualize data with just a few clicks. This feature enables agencies to quickly generate insights and make data-driven decisions.
Custom Properties
With the ability to create custom properties, Mixpanel allows for on-the-fly calculations and categorizations. This flexibility lets agencies define new metrics or segments without altering the underlying data, facilitating tailored analyses.
Cohort Analysis
Understanding user retention is crucial, and Mixpanel’s cohort analysis groups users based on shared characteristics or behaviors over time. Agencies can identify patterns, such as when users are most likely to drop off, and take action.
A/B Testing Integration
Mixpanel integrates with A/B testing tools, allowing agencies to assess the impact of different product variations on user behavior. You can find out what works and what doesn’t by conducting experiments.
Real-Time Data Visualization
Real-time data visualization in Mixpanel enables agencies to monitor user interactions as they happen. This immediacy allows for prompt responses to emerging trends or issues, ensuring that strategies remain relevant and effective.
User Segmentation
Agencies can segment users based on various attributes, such as demographics or behavior, using Mixpanel’s user segmentation feature. This capability supports targeted marketing campaigns and personalized user experiences.
Retention Reports
Mixpanel’s retention reports provide insights into how often users return to your product after their initial visit. Agencies can use this information to identify successful features and areas needing improvement.
Pros of Mixpanel:
- Real-time tracking enhances decision-making speed.
- Detailed event tracking improves conversion rates.
- Powerful segmentation enables targeted marketing strategies.
- Funnel analysis identifies user drop-off points.
- Clear visuals facilitate quick, informed decisions.
Cons of Mixpanel:
- Limited data export customization options.
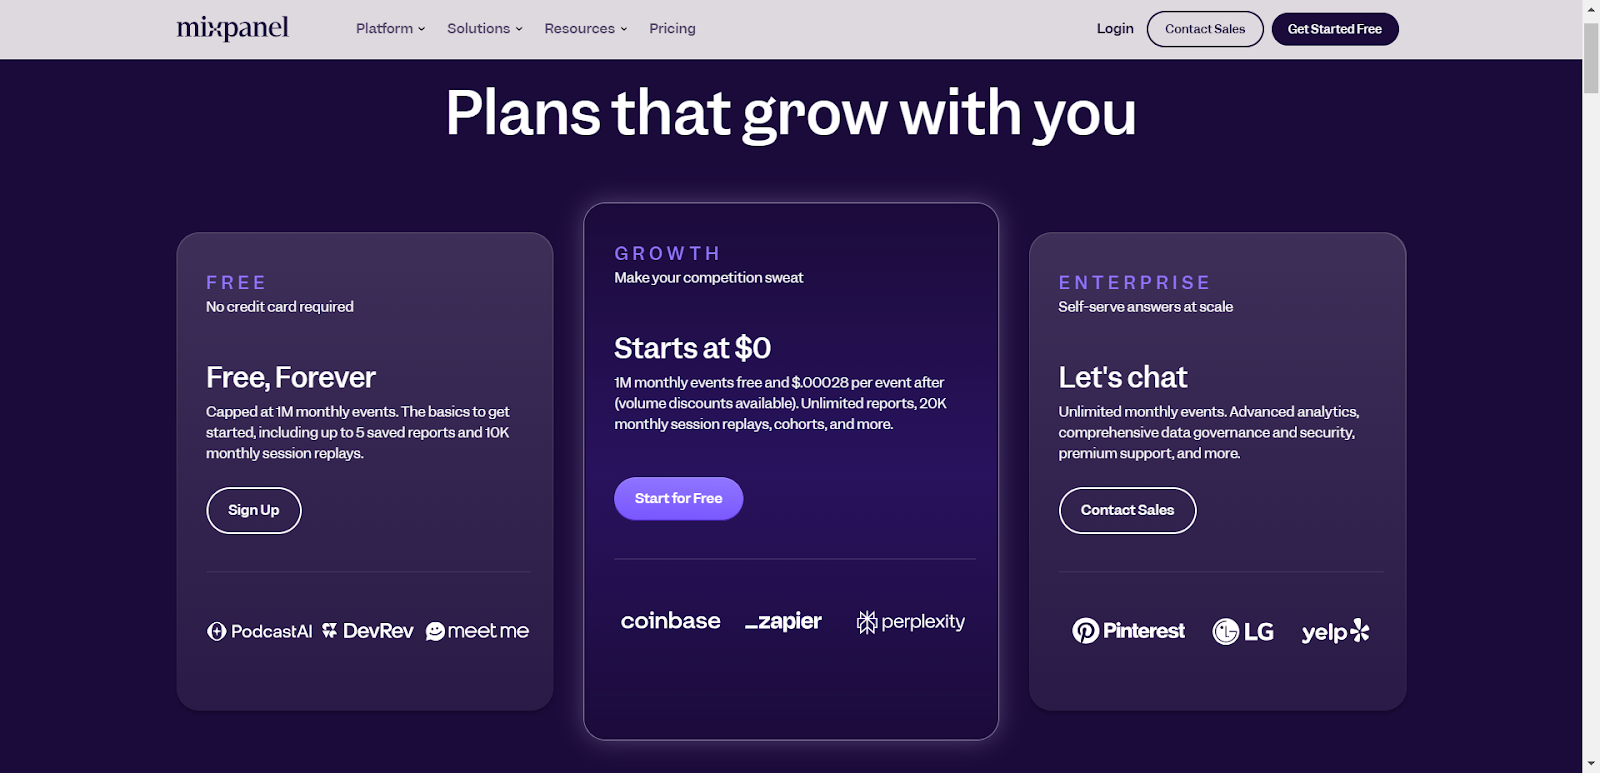
Mixpanel Pricing
What Users Say About Mixpanel?
Rating on G2: 4.6 out of 5
“Mixpanel enables effective and quick product analytics.
What do you like best about Mixpanel?
Mixpanel stands out for its real-time tracking. The UI is clean, fast, and easy to use. It supports both server-side and client-side event tracking, making it flexible. Data can be exported in multiple formats, and the API makes extraction seamless. Great for deep user behavior analysis. Customer support is very resposive and capable. Reports are very user friednly.
What do you dislike about Mixpanel?
The data export API can be improved by making it customizable.” – Piyush R.
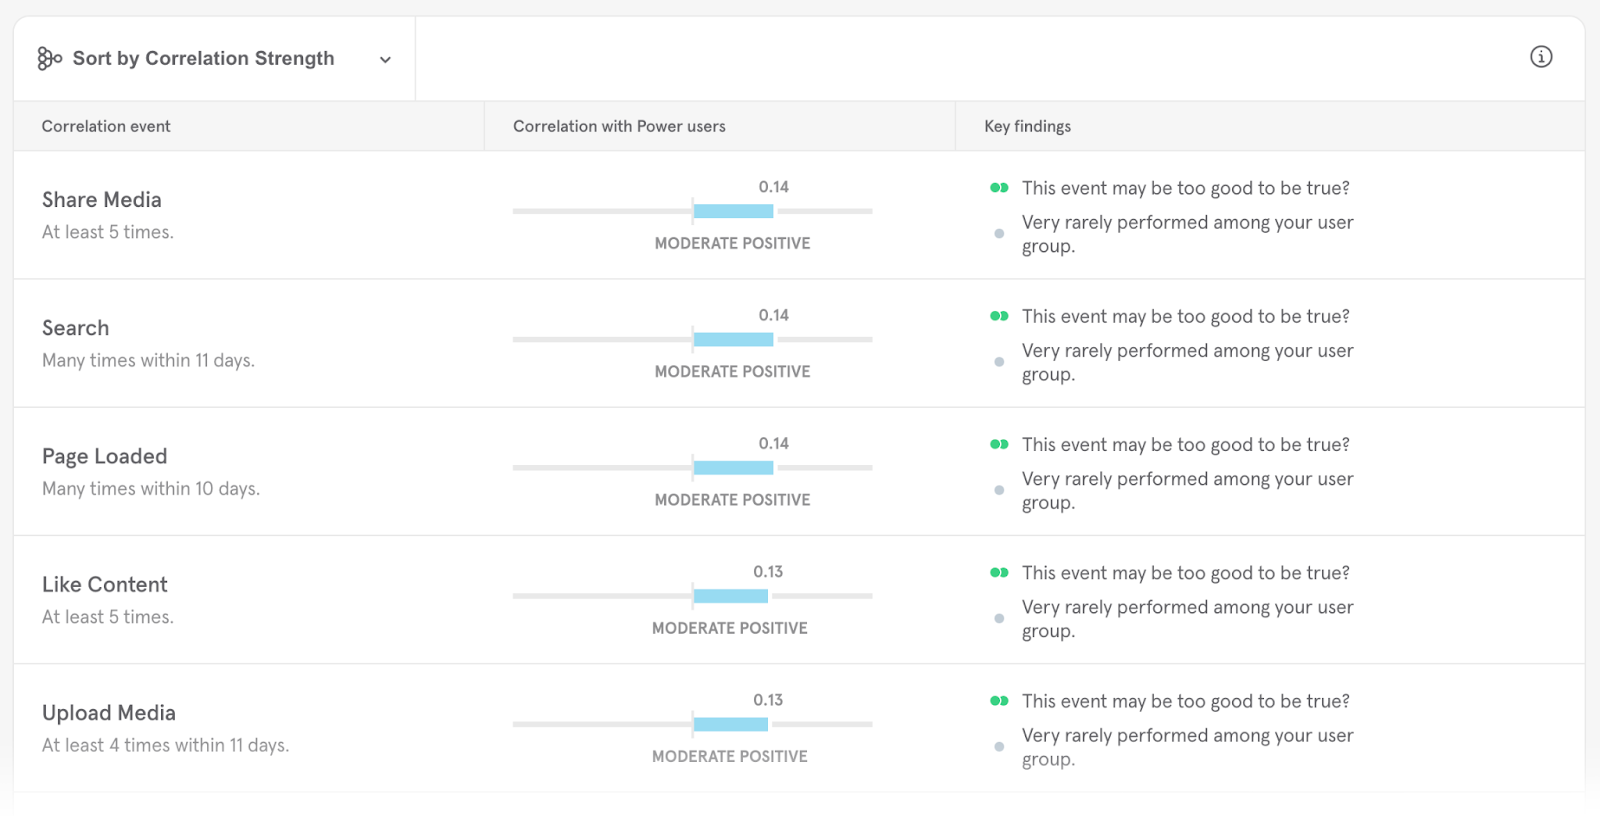
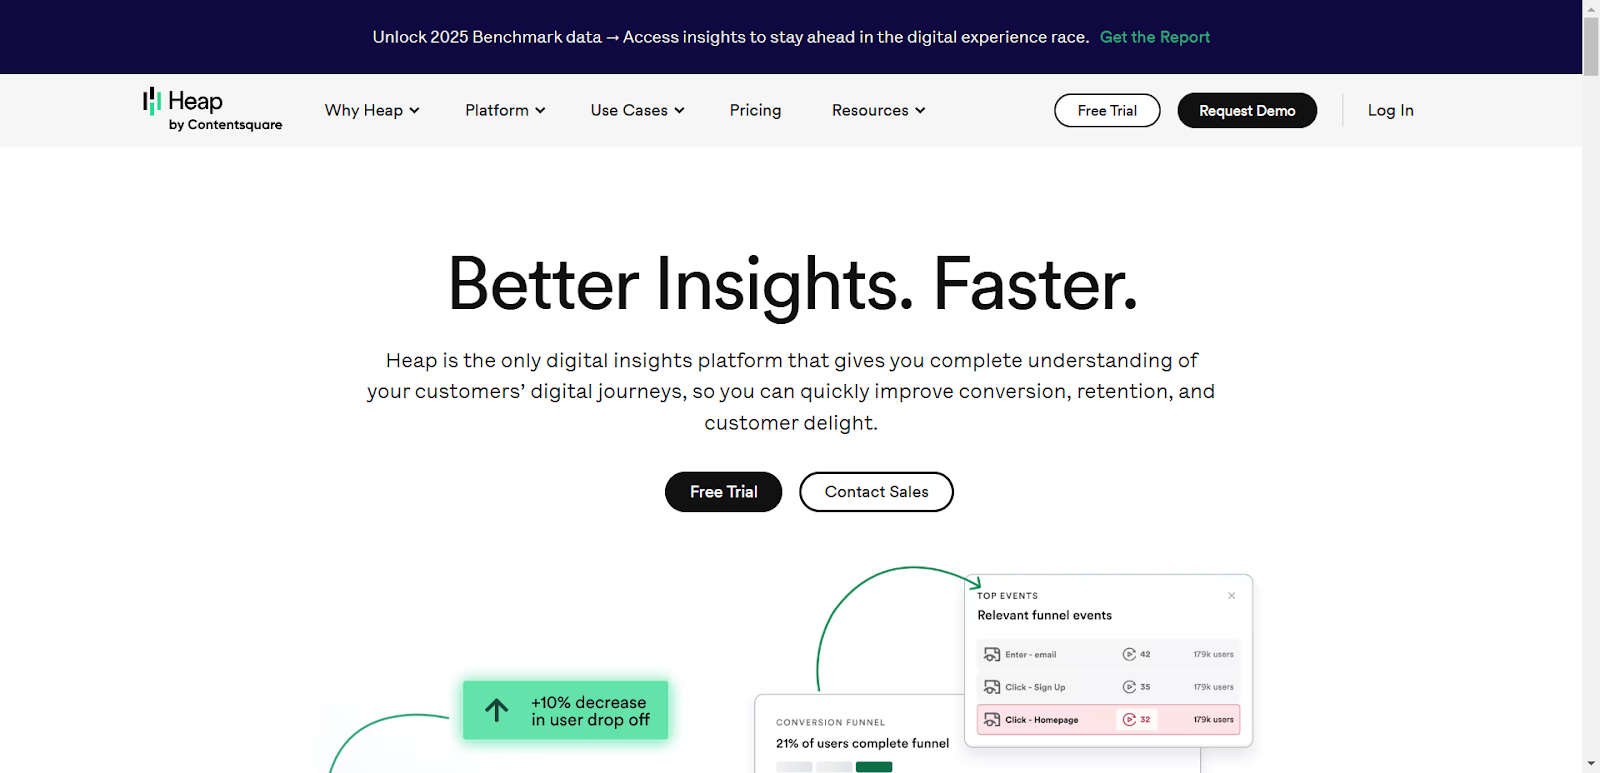
7. Heap.io
Heap.io’s automatic data capture and comprehensive user journey analysis is just what you need to run your e-commerce website.
By capturing every user interaction automatically, Heap eliminates the need for manual event tracking, ensuring no data is missed. This includes capturing clicks, swipes, taps, pageviews, and form submissions from the moment of installation.
Such detailed data collection allows agencies to analyze user behavior in detail, identifying friction points and opportunities for improvement.
Additionally, Heap’s Journey Maps provide a clear visualization of all customer journeys. With it, your product team can identify moments of greatest opportunity and areas needing attention.
It has a tool called Effort Analysis that quantifies user interactions between steps in a funnel, highlighting areas where users encounter difficulties. If your cart abandonment rate is high, this can be a game-changer for you.
In contrast to Heap’s Autocapture, Mixpanel requires manual event tracking. This makes Heap more suitable for lower client acquisition costs by eliminating the overhead of manual event tracking.
Key Features of Heap.io:
Heap.io excels with features that take the guesswork out of user behavior analysis. Here are the top features to look out for:
Automatic Data Capture
Heap’s auto-capture technology records every user interaction on your site or app without manual event tagging. This ensures a complete dataset, allowing agencies to analyze user behavior comprehensively.
Journey Maps
With Journey Maps, visualize every path users take through your product, complete with conversion rates for each step. This clarity helps identify popular features and potential drop-off points.
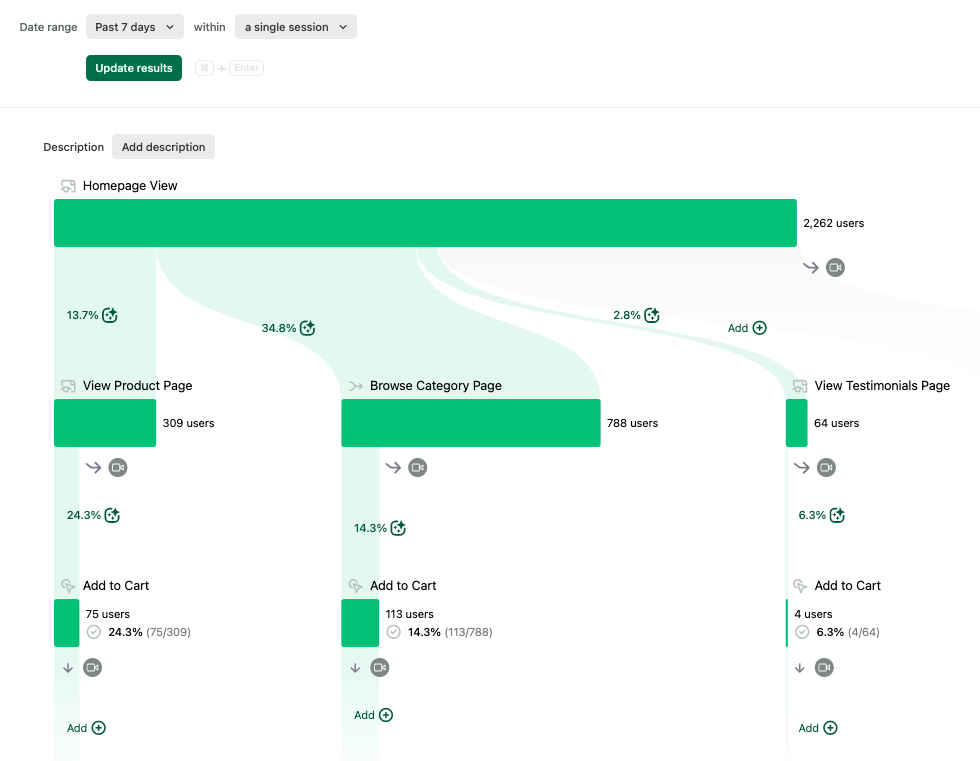
Effort Analysis
Effort Analysis quantifies user friction by measuring interactions and time spent between steps in a funnel. Agencies can pinpoint areas causing user frustration and optimize them to improve conversion rates.
Session Replay
Session Replay provides a visual playback of user sessions, offering context behind user actions. This feature aids in understanding user behavior and identifying usability issues.
Data Science-Powered Insights
Heap Illuminate leverages data science to automatically surface key moments of friction and opportunity in the user experience. This proactive approach helps agencies focus on impactful areas for improvement.
Comprehensive Integrations
Heap’s Sources feature allows integration with over 40 tools, consolidating data from various parts of the customer journey. This unified view enables deeper analysis and more informed decision-making.
Visual Labeling
Visual Labeling enables team members to quickly access and organize data without engineering assistance. This flexibility ensures that agencies can adapt their analytics to evolving needs efficiently.
Real-Time Analytics
Heap provides real-time access to user data, allowing agencies to monitor and respond to user behaviors as they occur. This immediacy supports timely interventions and strategy adjustments
Heap.io Pros:
- Autocapture records all user interactions automatically.
- Journey Maps visualize complete user paths.
- Session Replay provides visual session playback.
- Visual Labeling enables quick data organization.
- Data Science Insights highlights key moments.
Heap.io Cons:
- Occasional slowness in generating reports.
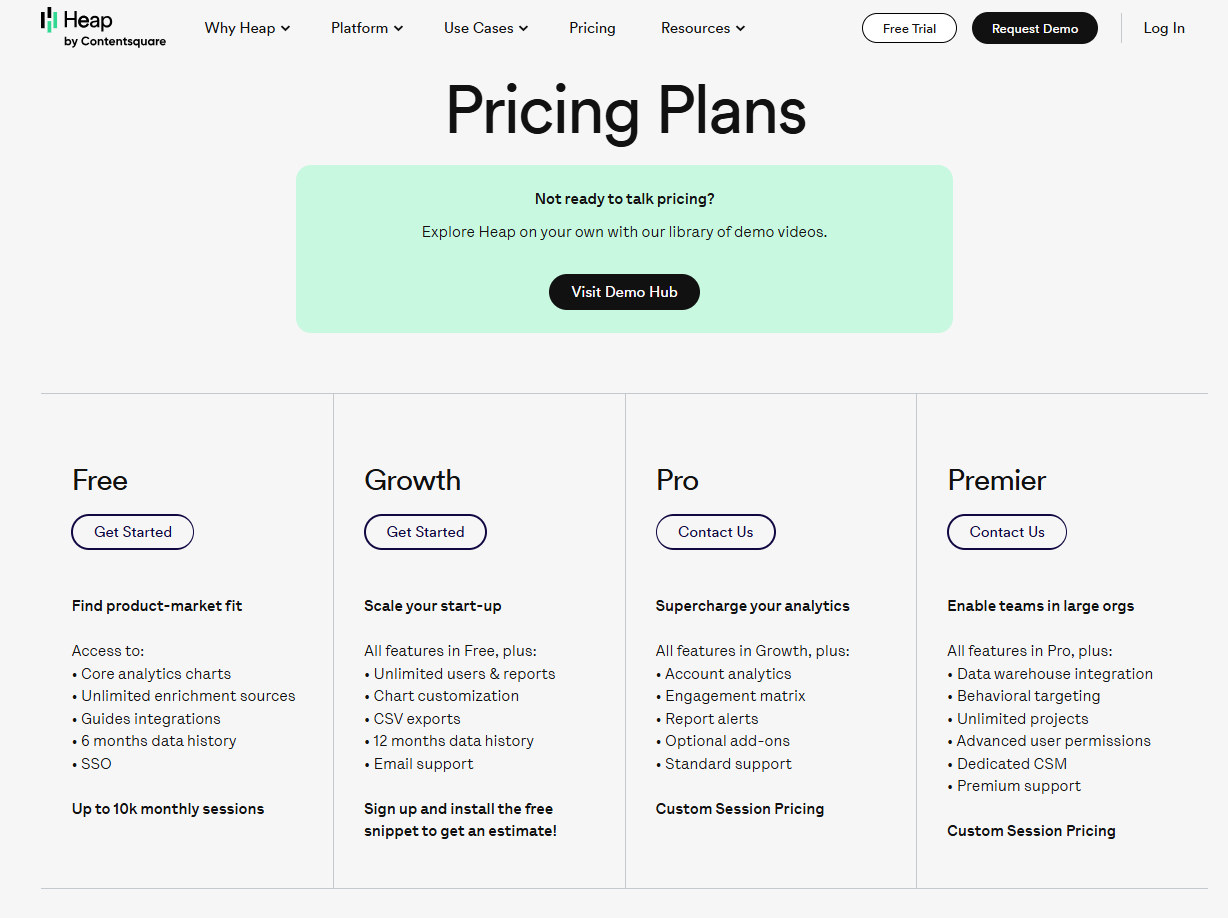
Heap.io Pricing:
Heap.io offers a Free plan with up to 10,000 sessions per month. The Growth plan, starting at $3,600 annually, includes up to 40,000 sessions monthly. For advanced needs, Pro and Premier plans provide custom features and pricing is available upon request.
What Users Say About Heap.io?
Rating on G2: 4.4 out of 5
“An excellent autocapture tool for clickstream data
What do you like best about Heap?
The live data stream makes tagging exactly the right event beyond easy. The metadata that comes along with each event out of the box is better than other autocapture tools and saves me so much time. The reporting capabilities are also more robust than other options, and you can build a wider variety of reports with Heap than you can with similar tools.
What do you dislike about Heap?
I have not found Journeys to be as helpful as it was cracked up to be, but otherwise the reporting is great. Other very minor things, like checking on plan usage only shows you how many total sessions you’ve used, not X sessions out of Y allotment, so it’s not helpful really.” – Brittany P.
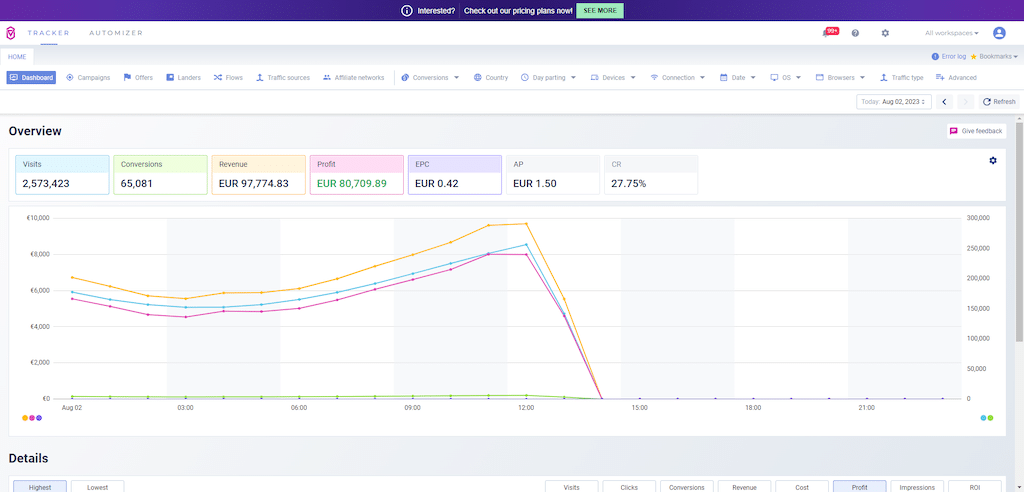
8. Voluum
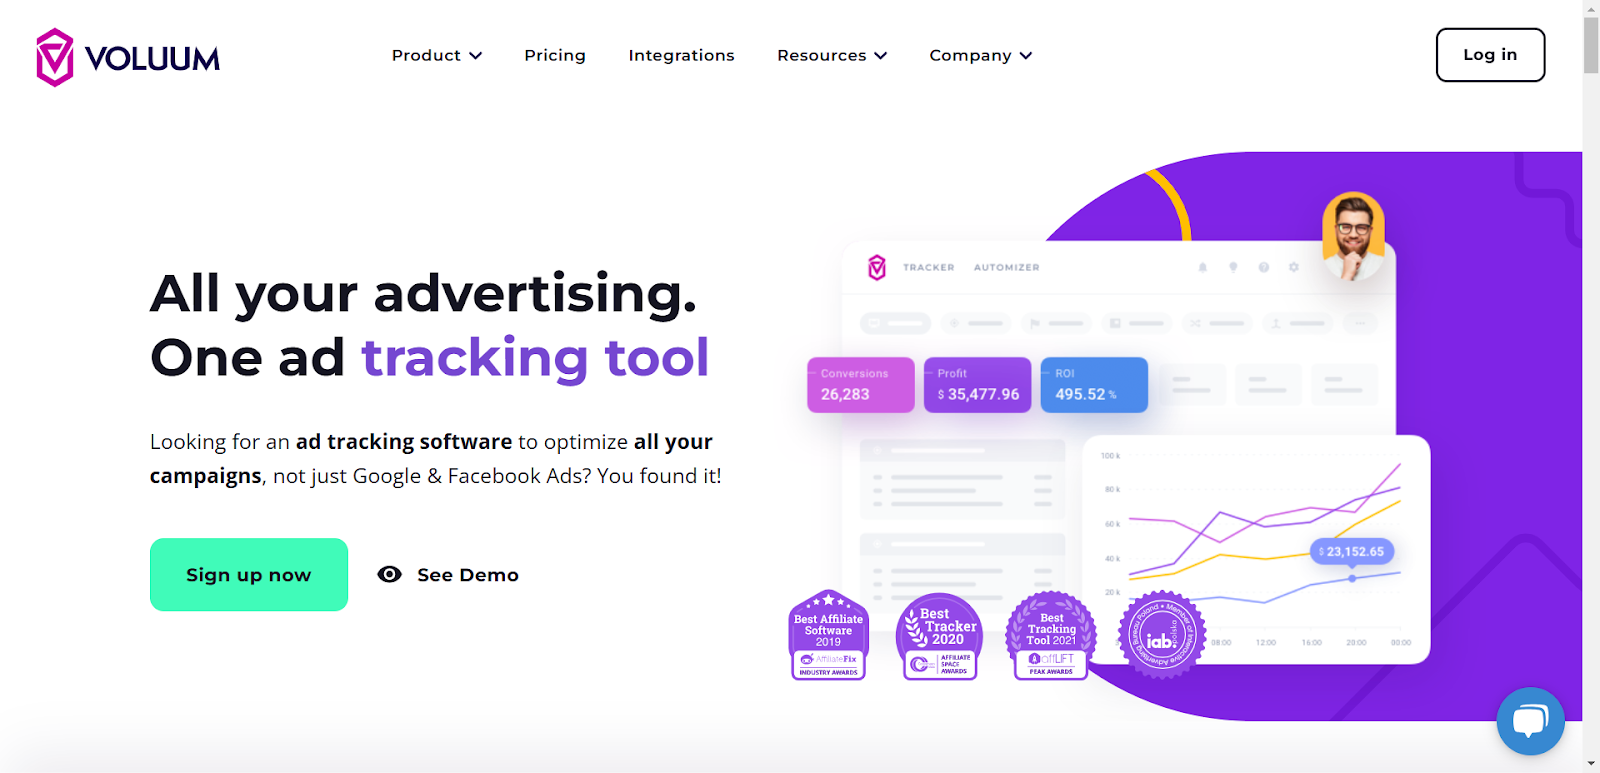
Voluum is an analytics platform offering advanced ad tracking and optimization tools. It’s perfect for marketing and advertising agencies.
One of its most powerful features is the Traffic Distribution AI, which intelligently allocates traffic to the best-performing paths. It’s a great way to ensure that your marketing efforts yield the highest possible returns.
Additionally, Voluum’s Automizer integrates with multiple traffic sources, allowing for the creation of automatic rules that launch based on your specified criteria. This feature streamlines campaign management. It reduces manual workload and increases responsiveness to performance data.
Furthermore, Voluum offers A/B Testing for Flows, enabling you to automatically run split tests to determine which campaign paths yield the best results. This facilitates data-driven decisions to optimize your marketing strategies.
In comparison, Heap automatically captures all user interactions, providing comprehensive behavior analytics. Voluum requires manual event tracking, focusing on detailed advertising campaign optimization.
Choose Heap for user behavior insights; opt for Voluum for ad performance tracking.
Key Features of Voluum:
Voluum offers features designed to focus on advanced tracking, real-time reporting, and automated optimization:
Real-Time Reporting
Voluum provides immediate access to campaign data, allowing agencies to monitor over 30 metrics for each visit, click, and conversion. This instant insight facilitates timely adjustments to optimize performance.
Traffic Distribution AI
The platform’s AI-driven system automatically allocates traffic to the best-performing paths, offers, and landing pages. By analyzing data from the last 24 hours and adjusting every minute, it maximizes campaign efficiency.
Automizer Integration
Voluum’s Automizer integrates with multiple traffic sources, enabling centralized campaign management. Users can set automatic rules, adjust bids, and pause or resume campaigns directly from the platform.
Anti-Fraud Kit
To protect advertising budgets, Voluum includes an Anti-Fraud Kit that detects suspicious clicks and visits. This feature helps identify and filter out invalid traffic, ensuring data integrity.
A/B Split Testing
Agencies can conduct A/B tests to determine the most effective offers and landing pages. This functionality supports data-driven decisions to enhance conversion rates.
Rule-Based Traffic Distribution
Voluum allows for the creation of custom rules to direct traffic based on specific conditions. This targeted approach ensures visitors receive the most relevant content, improving engagement.
Multi-User Collaboration
The platform supports multiple users with customizable access levels, facilitating teamwork within agencies. Workspaces can be organized to manage different clients or campaigns efficiently.
Pros:
- Real-time data on impressions, clicks, conversions
- AI-driven optimization enhances decision-making speed
- Seamless integration with major ad platforms
- Comprehensive reporting aids performance analysis
- Advanced tracking for diverse traffic sources
Cons:
- Limited customization in reporting features
- Complexity in setting up tracking parameters
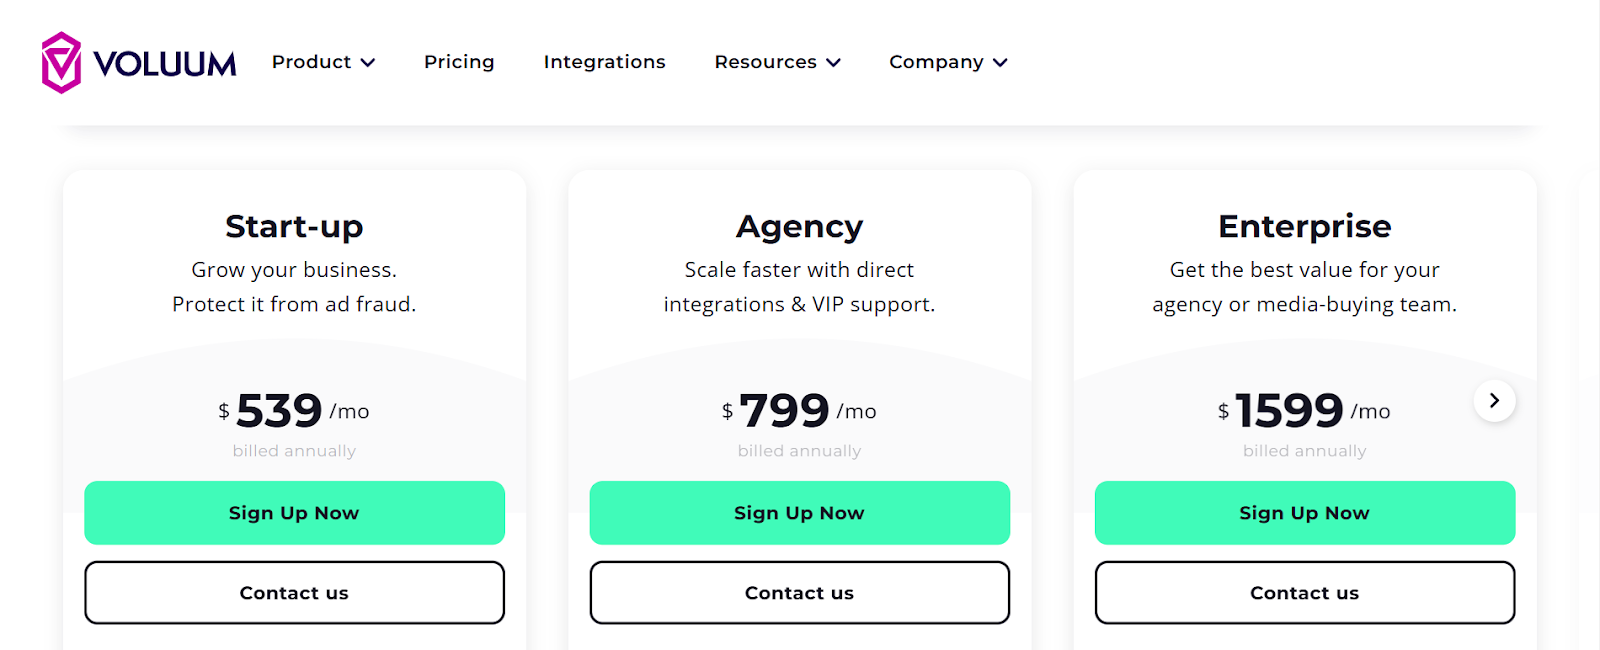
Voluum Pricing:
What Users Say About Voluum?
Rating on G2: 4.7 out of 5
“Great Experience with Jan D. from Voluum
What do you like best about Voluum?
Jan D. was very helpful in my onboarding process. He answered all of my questions, and showed me the various features of Voluum, like the rules-based Automizer.
What do you dislike about Voluum?
The price can seem pretty steep, just being honest. But the value and easy to use user interface makes it easier to overlook, despite the pricing.” – Monica M.
Key Features to Consider When Choosing Analytics Tools for Agencies
Selecting the right analytics tool is essential for agencies looking to track performance, optimize decision-making, and improve client reporting. Here are the key features to look for:
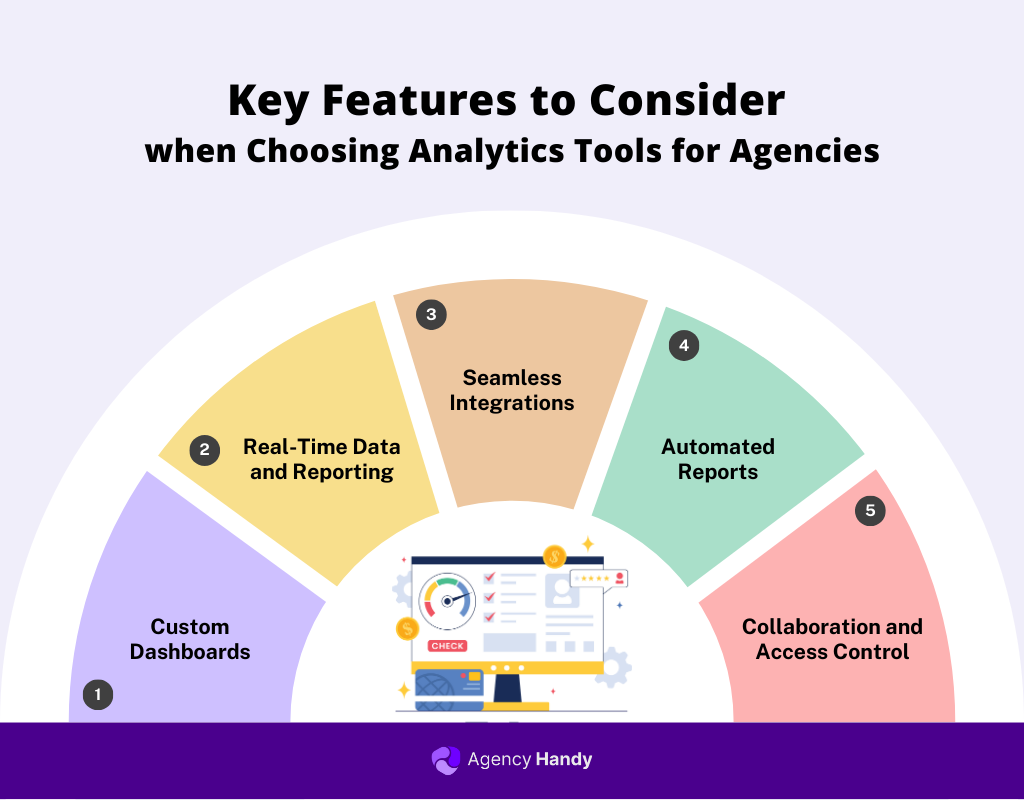
Custom Dashboards
A good analytics tool should provide fully customizable dashboards that display key metrics in a clear, visually appealing way. Personalized views help agencies monitor campaign performance, track client engagement, and gain insights at a glance.
Real-Time Data and Reporting
Access to real-time data allows agencies to respond quickly to trends and make informed decisions. Look for tools that offer live reporting and automatic data updates to keep performance tracking accurate and up to date.
Seamless Integrations
The best analytics platforms integrate smoothly with marketing, CRM, and project management tools. Connections with Google Analytics, HubSpot, and social media platforms ensure agencies can organize all their data in one place.
Automated Reports
Manual reporting can be time-consuming. Choose a tool that automates client reports, schedules regular updates, and generates detailed insights effortlessly. This not only saves time but also ensures consistent and professional reporting.
Collaboration and Access Control
For agencies managing multiple clients, collaboration features like team access, role-based permissions, and shared reports are essential. These tools keep teams aligned while maintaining data security.
Conclusion
The right analytics tool helps you track performance, manage tasks, and support clients better. It organizes data efficiently and automates repetitive work, making your job easier. With the right system, you can work smarter and make informed choices.
Choosing a tool that fits your needs improves productivity and strengthens client relationships. It also helps you stay ahead in a fast-changing market.
The goal is simple—find a solution that makes your work easier and gives you clear, useful insights.
Frequently Asked Questions (FAQs)
What should agencies consider when choosing an analytics tool?
Look for a tool that fits your needs. It should help with data visualization, client reporting, and team productivity tracking. Make sure it works with your existing software. Also, choose one that is easy to use and can grow with your business.
How can analytics tools improve agency client retention?
Clear insights and honest reporting show clients the value of your work. A tool with white-label dashboards and client portals improves communication. When clients see results and understand the process, they trust you more and stay longer.
Are there free analytics tools suitable for agencies?
Yes, some free tools, like Google Analytics, offer strong features for tracking website performance. But if you need advanced options, you may have to invest in a paid tool for better functionality and scalability.
How do integrations increase the value of analytics tools?
Integrations help your analytics tool work with CRMs, project management software, and marketing tools. This keeps all your data in one place, making it easier to manage projects and track performance. A connected system saves time and improves decision-making.


